Debugging an Application Running in Docker With IntelliJ IDEA
Last updated: January 8, 2024


Mocking is an essential part of unit testing, and the Mockito library makes it easy to write clean and intuitive unit tests for your Java code.
Get started with mocking and improve your application tests using our Mockito guide:
Handling concurrency in an application can be a tricky process with many potential pitfalls. A solid grasp of the fundamentals will go a long way to help minimize these issues.
Get started with understanding multi-threaded applications with our Java Concurrency guide:
Spring 5 added support for reactive programming with the Spring WebFlux module, which has been improved upon ever since. Get started with the Reactor project basics and reactive programming in Spring Boot:
Since its introduction in Java 8, the Stream API has become a staple of Java development. The basic operations like iterating, filtering, mapping sequences of elements are deceptively simple to use.
But these can also be overused and fall into some common pitfalls.
To get a better understanding on how Streams work and how to combine them with other language features, check out our guide to Java Streams:
Explore Spring Boot 3 and Spring 6 in-depth through building a full REST API with the framework:
Yes, Spring Security can be complex, from the more advanced functionality within the Core to the deep OAuth support in the framework.
I built the security material as two full courses - Core and OAuth, to get practical with these more complex scenarios. We explore when and how to use each feature and code through it on the backing project.
You can explore the course here:
Spring Data JPA is a great way to handle the complexity of JPA with the powerful simplicity of Spring Boot.
Get started with Spring Data JPA through the guided reference course:
Refactor Java code safely — and automatically — with OpenRewrite.
Refactoring big codebases by hand is slow, risky, and easy to put off. That’s where OpenRewrite comes in. The open-source framework for large-scale, automated code transformations helps teams modernize safely and consistently.
Each month, the creators and maintainers of OpenRewrite at Moderne run live, hands-on training sessions — one for newcomers and one for experienced users. You’ll see how recipes work, how to apply them across projects, and how to modernize code with confidence.
Join the next session, bring your questions, and learn how to automate the kind of work that usually eats your sprint time.
Yes, we're now running our only Summer Sale. All Courses are 30% off until 20th July, 2026:
Yes, we're now running our only Summer Sale. All Courses are 30% off until 20th July, 2026:
1. Overview
In this tutorial, we’ll see how to debug a Docker container in IntelliJ. We assume that we have a Docker image ready for testing. There are various ways to build Docker images.
IntelliJ can be downloaded from its official website.
For this article, we’ll refer to this single class-based Java application. It can be easily dockerized, built, and tested.
Before starting the testing, we need to make sure that the Docker engine is started and running on our computer.
2. Using the Dockerfile Configuration
When using the Docker file configuration, we need to simply select our Dockerfile and provide appropriate names for image name, image tag, container name, and configuration name. We may also add port mappings, if any:
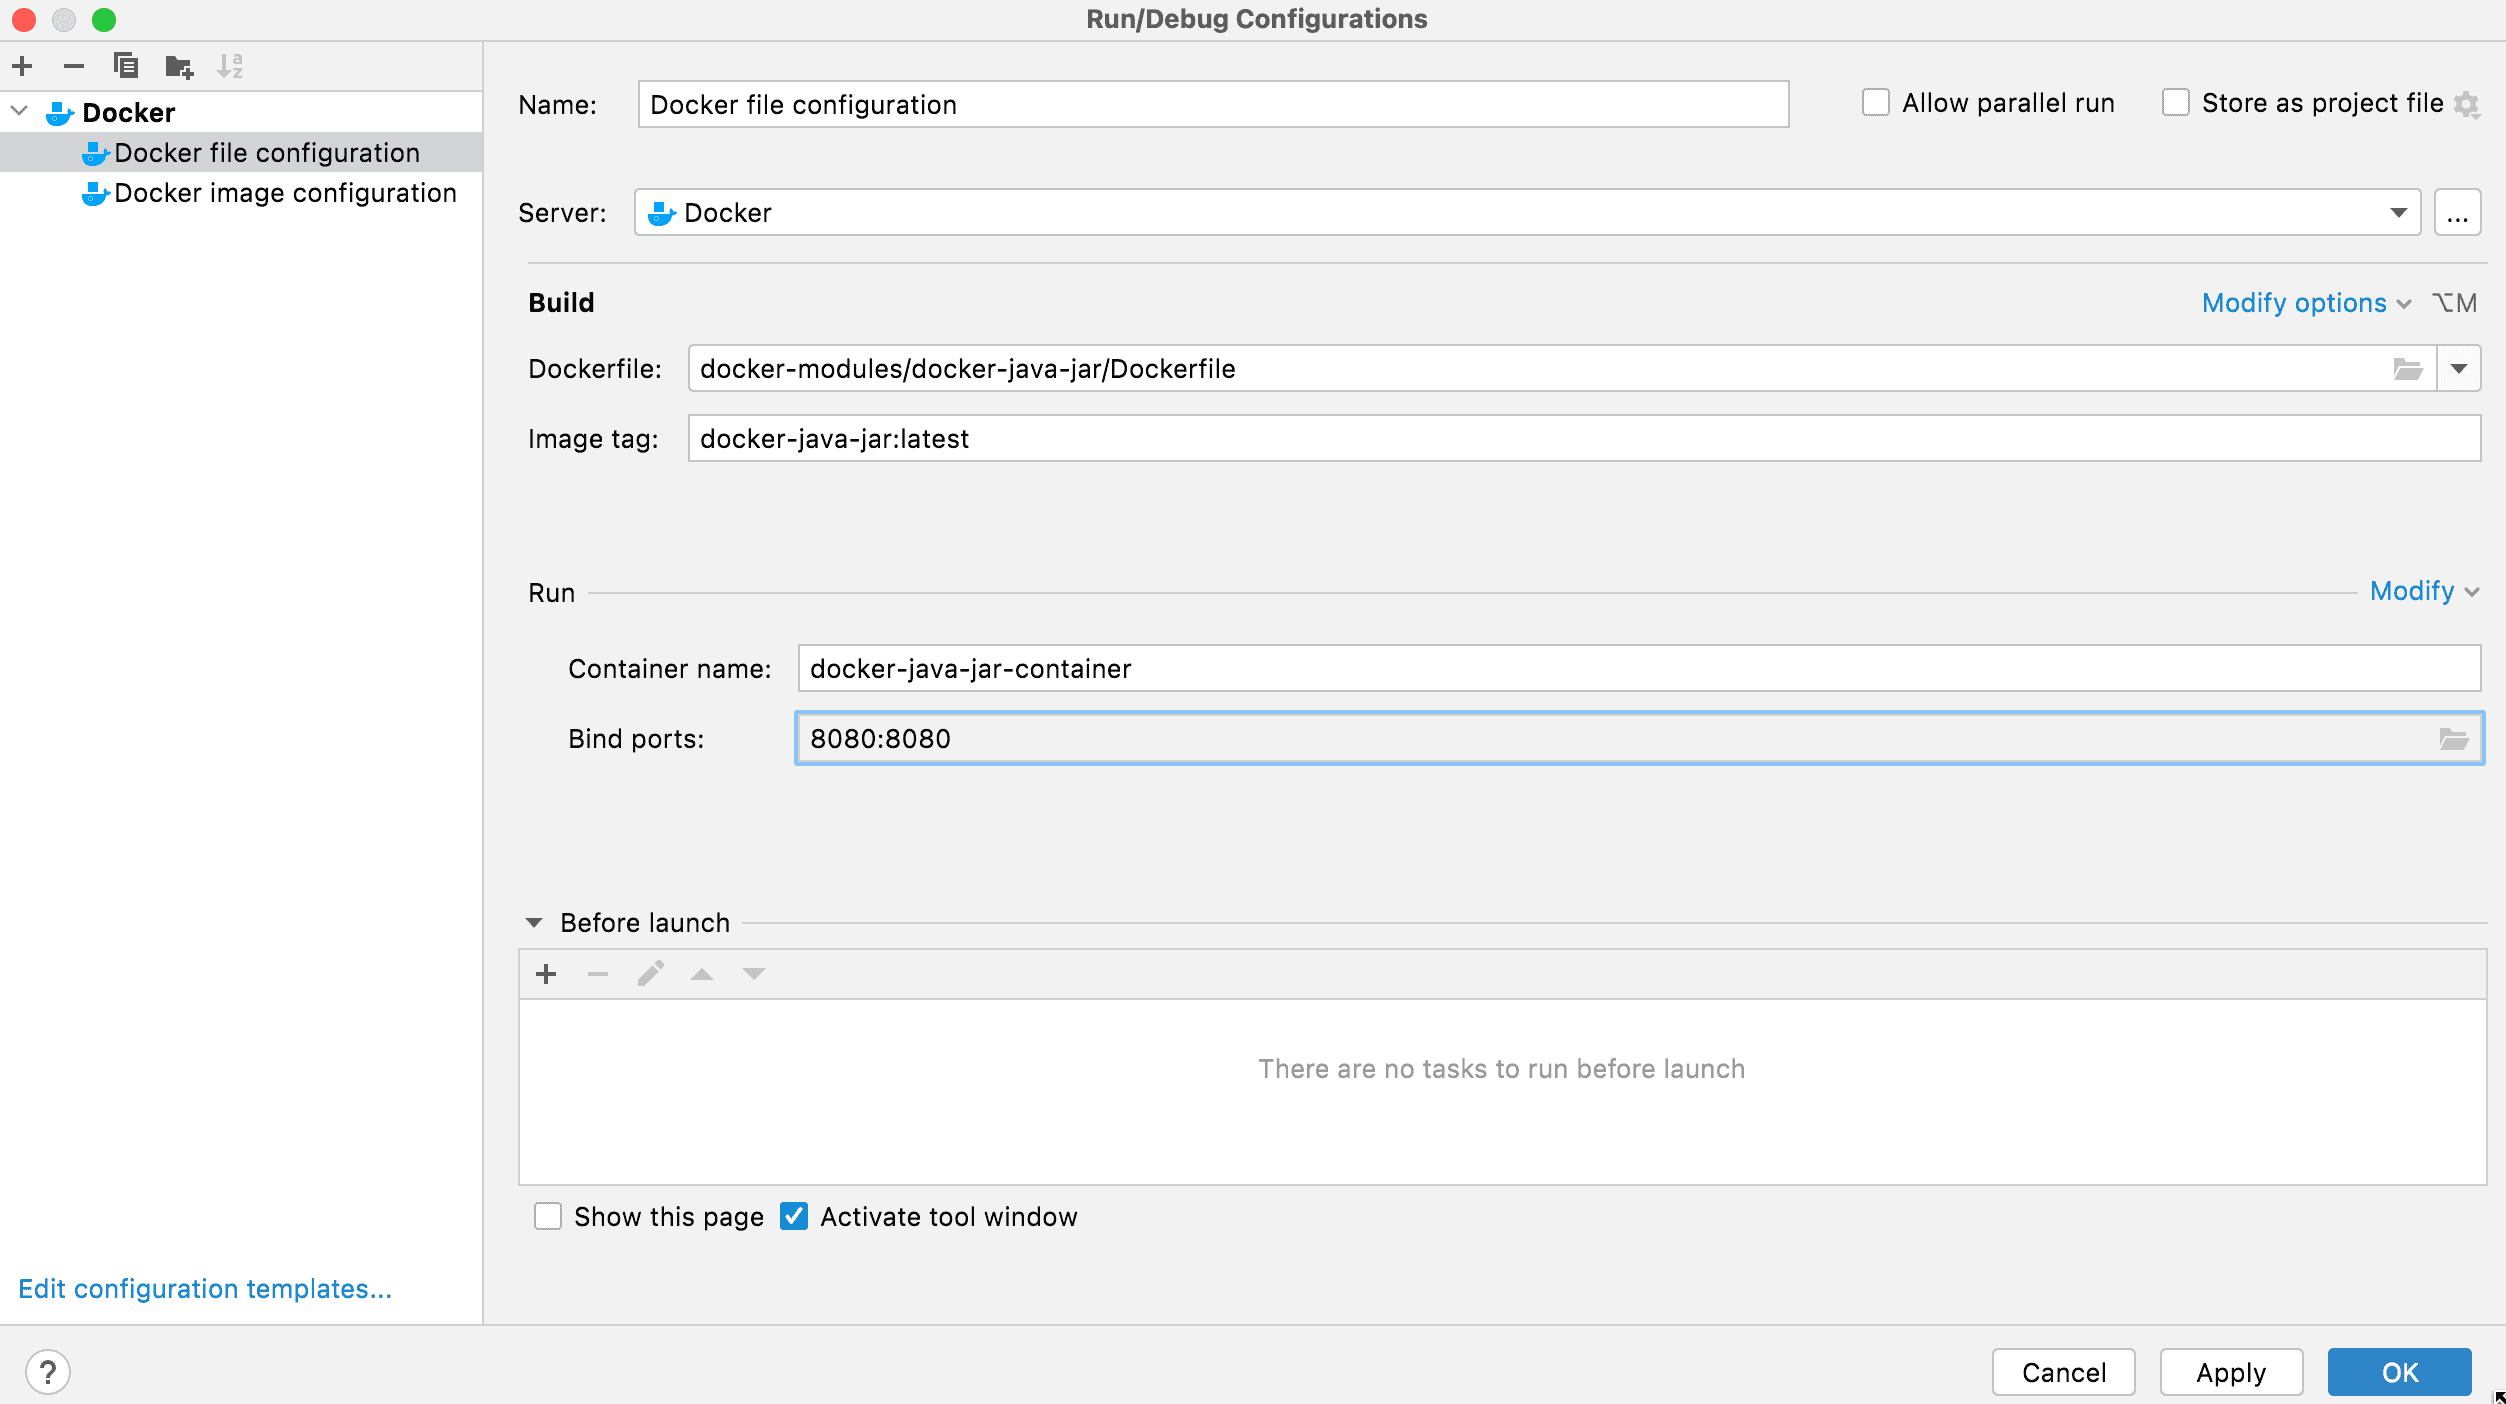
Once this configuration is saved, we can select this configuration from the debug option and hit debug. It first builds the image, registers the image in the Docker engine, and then runs the dockerized application.
3. Using the Docker Image Configuration
When using the Docker image configuration, we need to provide the image name, image tag, and container name of our application that we’ve pre-built. We can use standard Docker commands to build the image and register the container in the Docker engine. We may also add port mappings, if any:
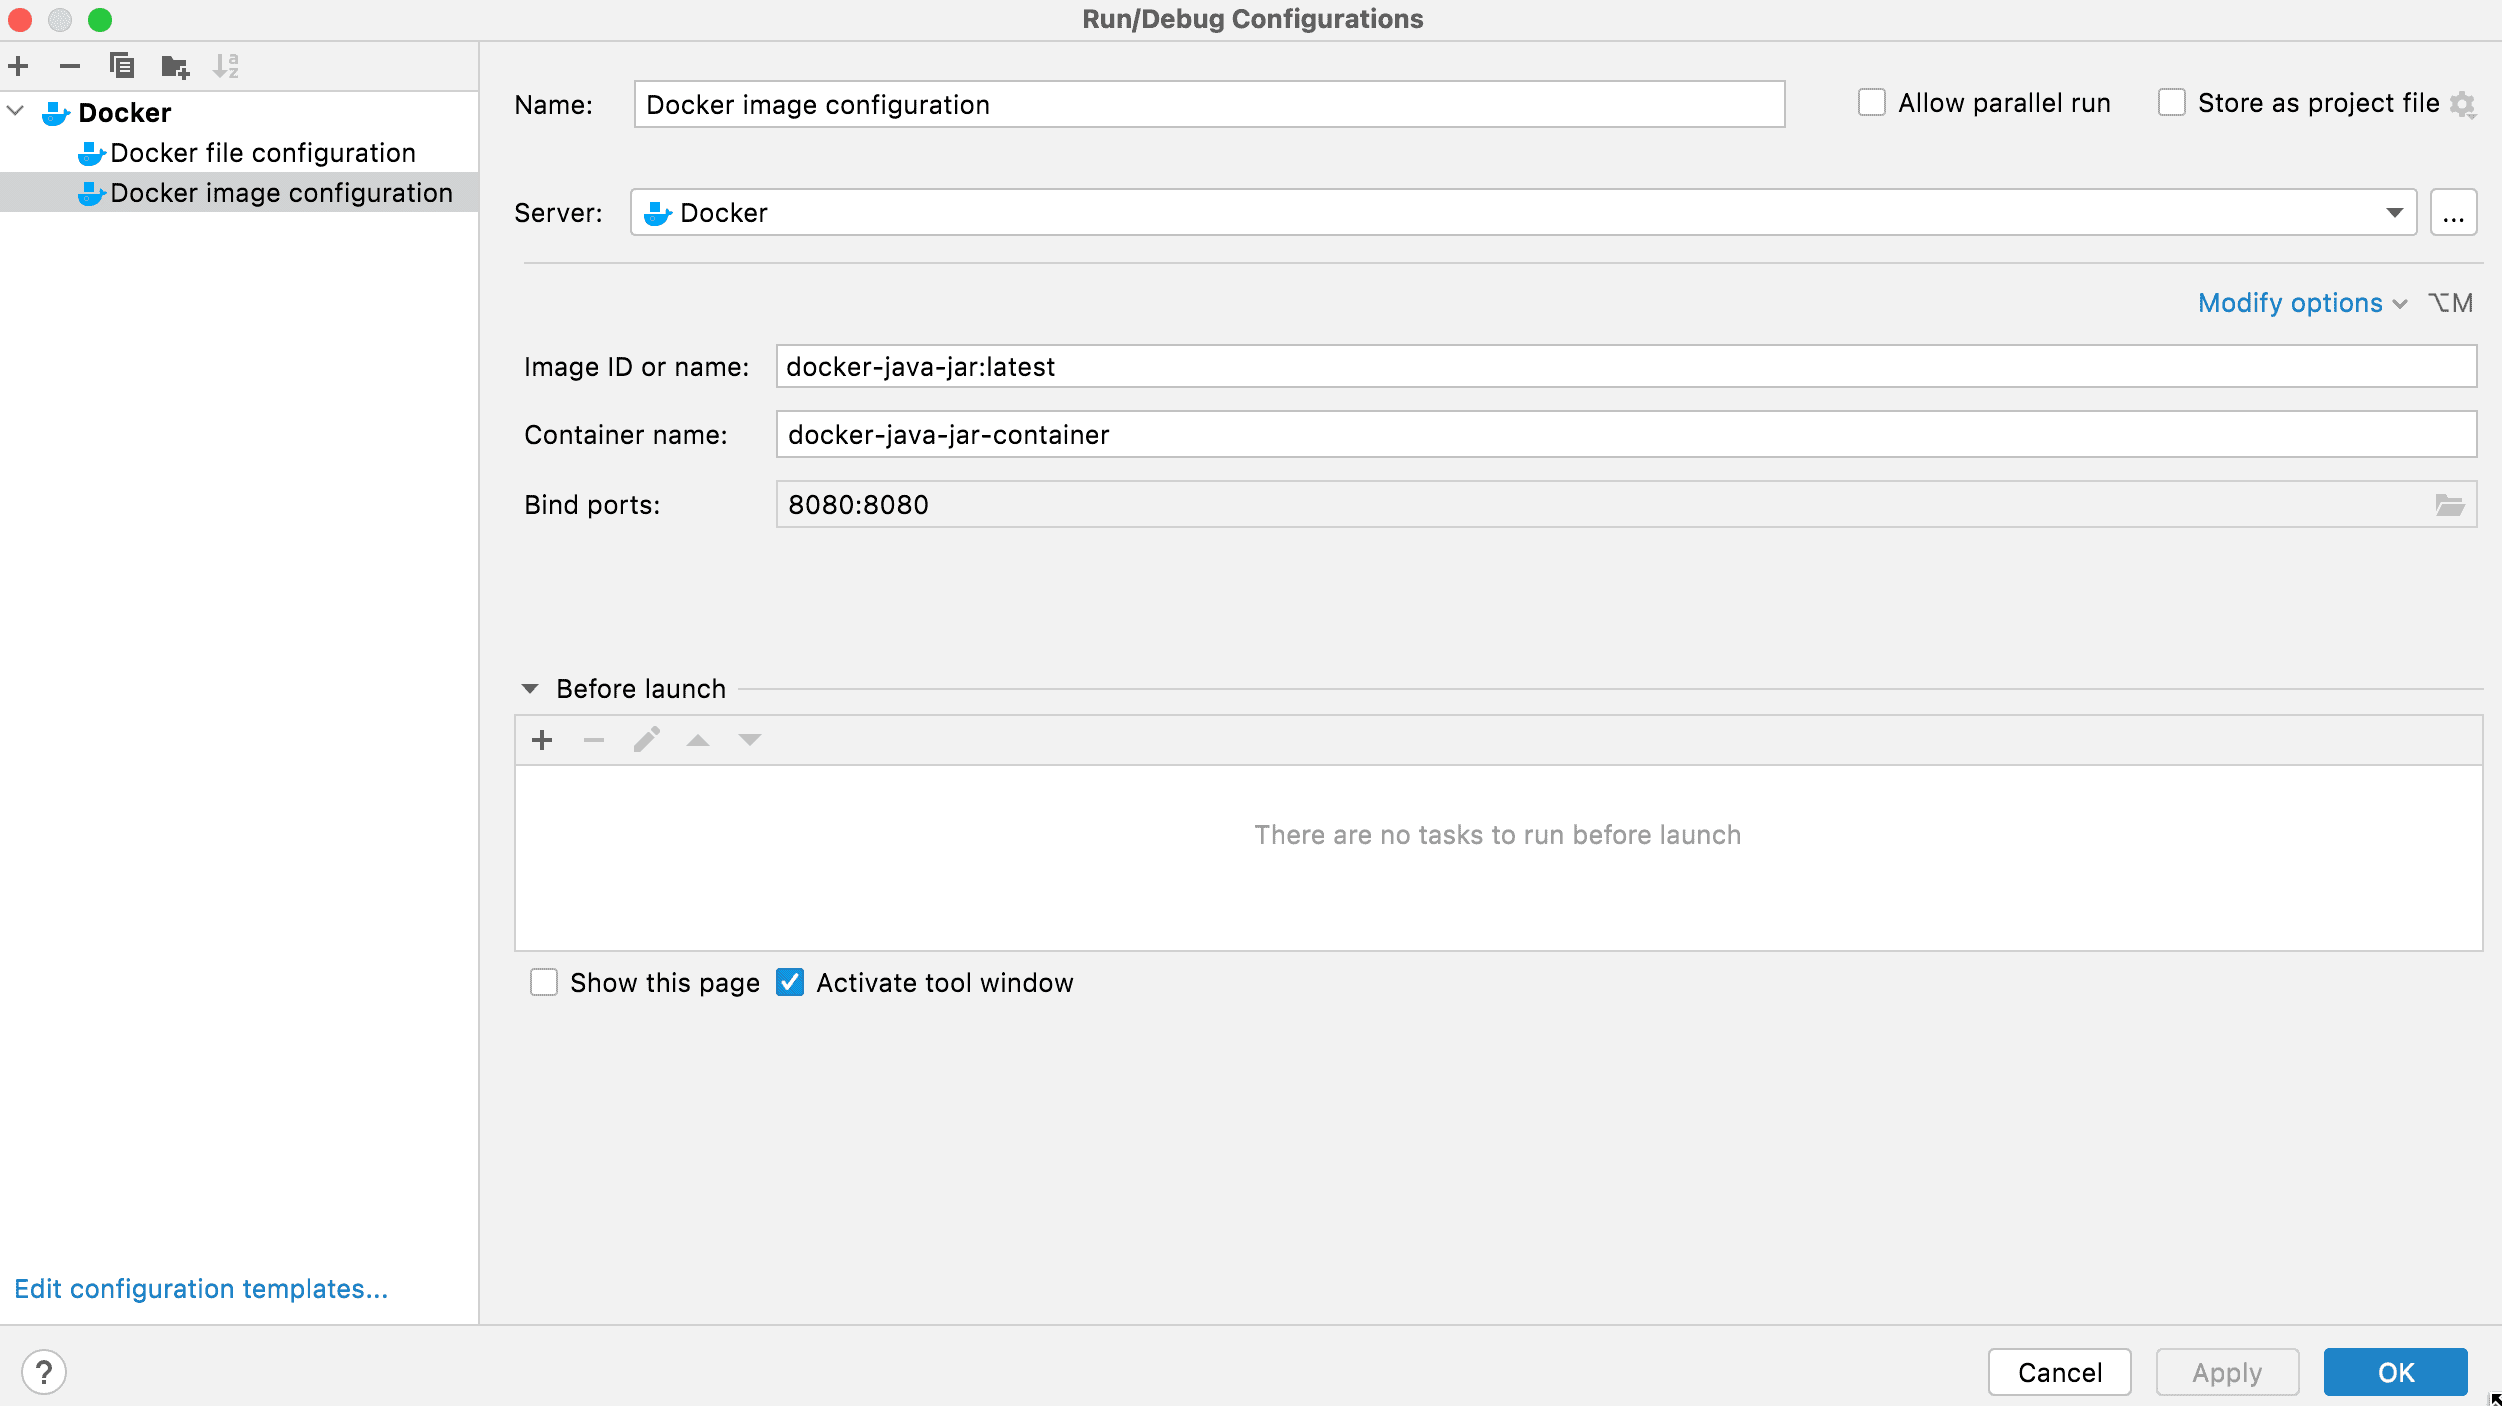
Once this configuration is saved, we can select this configuration from the debug option and hit debug. It simply selects the pre-built Docker image and container and runs it.
4. Using the Remote JVM Debug Configuration
A remote JVM configuration attaches itself to any pre-running Java process. So we need to run the Docker container individually first.
Here’s the command to run the Docker image for Java 8:
docker run -d -p 8080:8080 -p 5005:5005 -e JAVA_TOOL_OPTIONS="-agentlib:jdwp=transport=dt_socket,address=5005,server=y,suspend=n" docker-java-jar:latestIf we were using Java 11, we’d use this command instead:
docker run -d -p 8080:8080 -p 5005:5005 -e JAVA_TOOL_OPTIONS="-agentlib:jdwp=transport=dt_socket,address=*:5005,server=y,suspend=n" docker-java-jar:latestHere docker-java-jar is our image name, and latest is its tag. Apart from the normal HTTP port, which is 8080, we are also mapping an additional port, 5005, for remote debugging using the -p extension. We are using the -d extension for running docker in detached mode and -e for passing JAVA_TOOL_OPTIONS as an environment variable to the Java process.
In the JAVA_TOOL_OPTIONS we pass the value -agentlib:jdwp=transport=dt_shmem,address=,server=y,suspend=n to allow the Java process to start a JDB debug session and pass the value address=*:5005 to specify that 5005 will be our remote debugging port.
So the above command starts our Docker container, and we can now configure remote debugging configuration to connect to it:
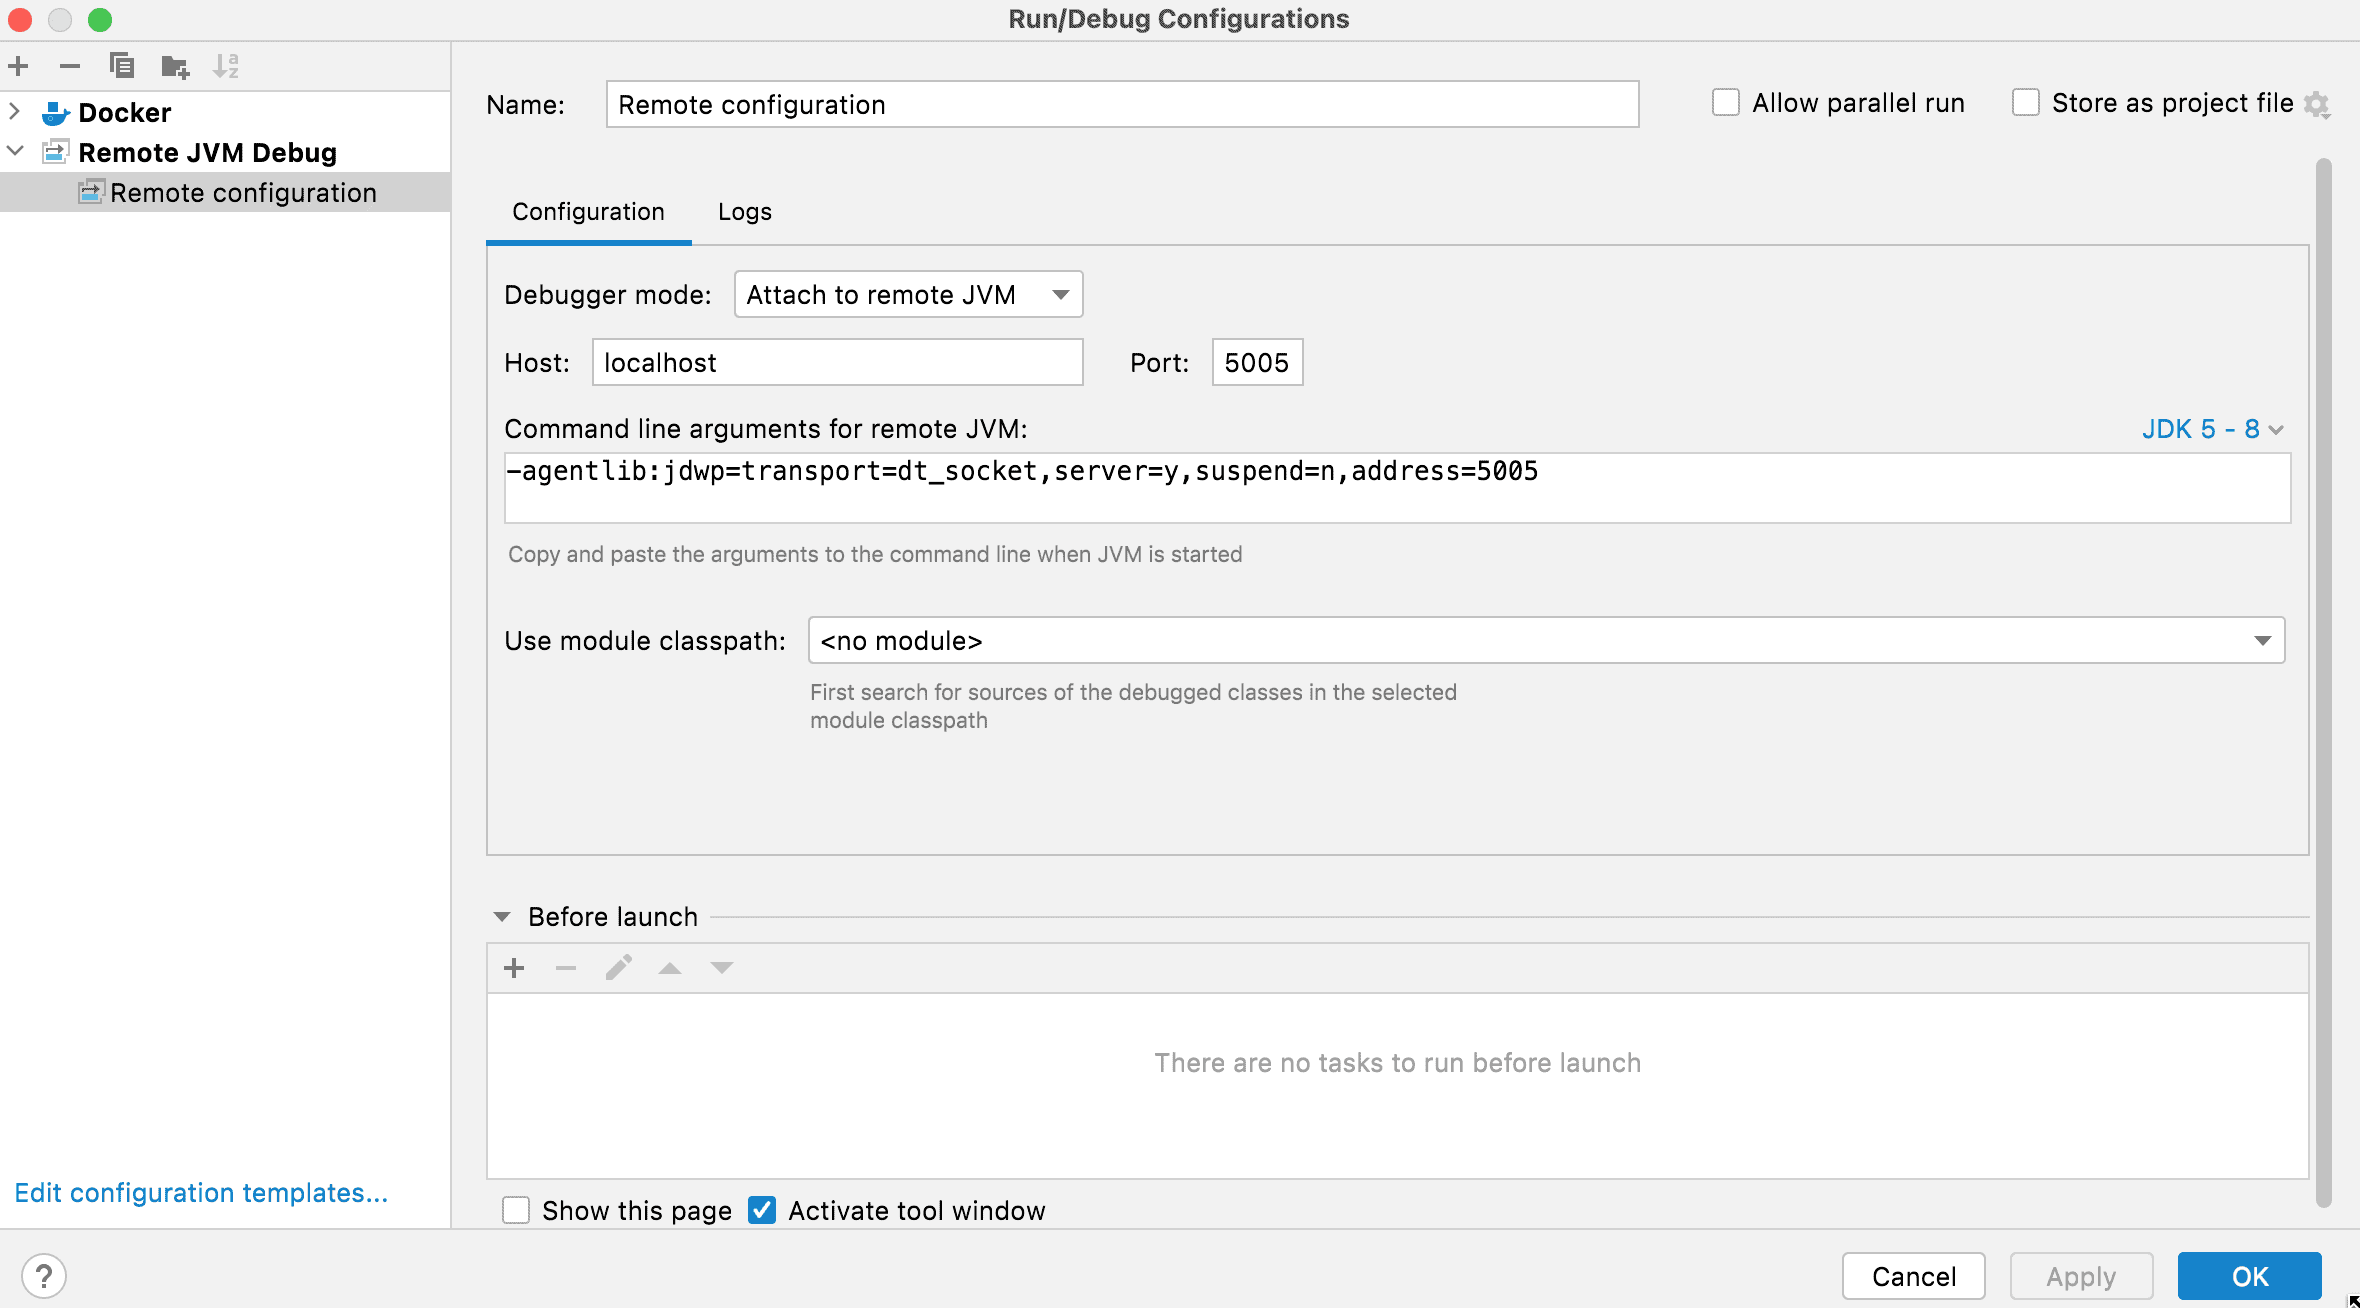
We can see that in the configuration we’ve specified it to connect to the remote JVM using the 5005 port.
Now, if we select this configuration from the debug options and click debug, it will start a debug session by attaching to the already running Docker container.
5. Conclusion
In this article, we learned different configuration options we can use to debug a dockerized application in IntelliJ.


