Learn through the super-clean Baeldung Pro experience:
>> Membership and Baeldung Pro.
No ads, dark-mode and 6 months free of IntelliJ Idea Ultimate to start with.
Last updated: March 18, 2024
In this article, we’ll learn about the system and service management of Linux operating systems under the widely-used systemd. We’ll discuss how we can display execution trees, hierarchies, and dependencies of the services running in our system.
The service management program systemd comes with the systemd-analyze command. We can use this tool in several different ways to see the services in our system.
The command systemd-analyze will let us determine the performance statistics of the booting operation and other information related to systemd. When we use the system-analyze without arguments, we get the startup performance, including the time before the system reaches user space:
$ systemd-analyze
Startup finished in 3.570s (kernel) + 19.731s (userspace) = 23.302s
graphical.target reached after 15.300s in userspace.
This time includes the time spent in the kernel, initial RAM disk, and so on. It doesn’t include all time until fully completed initialization, for example, when the hard drive is idle.
We can also retrieve a tree of the critical-chain of units:
$ systemd-analyze critical-chain
...
graphical.target @15.300s
└─multi-user.target @15.298s
  └─systemd-logind.service @13.746s +1.547s
    └─basic.target @13.662s
      └─sockets.target @13.660s
        └─dbus.socket @13.658s
          └─sysinit.target @13.637s
            └─systemd-update-utmp.service @13.590s +46ms
              └─systemd-tmpfiles-setup.service @13.370s +190ms
                └─systemd-journal-flush.service @2.843s +10.503s
                  └─systemd-remount-fs.service @2.473s +164ms
                    └─systemd-journald.socket @2.218s
                      └─-.mount @2.081s
                        └─-.slice @2.081s
All lines will have one timestamp. In some lines, there might be another extra time. Depending on the formatting settings of our terminal, we’ll see those lines containing two timestamps in red. After the @ character, we see the time when the unit became active. After the + character, we see the time the unit took to start. We should not be misled by the output due to one service initialization (that might depend on the activation of another socket) or parallel unit execution.
Finally, we can also include the –fuzz option with a timespan:
$ systemd-analyze critical-chain --fuzz=1m
...
graphical.target @15.300s
└─multi-user.target @15.298s
├─systemd-logind.service @13.746s +1.547s
│ ├─basic.target @13.662s
│ │ ├─sockets.target @13.660s
│ │ │ ├─dbus.socket @13.658s
│ │ │ │ ├─sysinit.target @13.637s
│ │ │ │ │ ├─systemd-update-utmp.service @13.590s +46ms
│ │ │ │ │ │ ├─systemd-tmpfiles-setup.service @13.370s +190ms
│ │ │ │ │ │ │ ├─systemd-journal-flush.service @2.843s +10.503s
│ │ │ │ │ │ │ │ ├─systemd-remount-fs.service @2.473s +164ms
│ │ │ │ │ │ │ │ │ ├─systemd-journald.socket @2.218s
│ │ │ │ │ │ │ │ │ │ ├─-.mount @2.081s
│ │ │ │ │ │ │ │ │ │ │ └─-.slice @2.081s
│ │ │ │ │ │ │ │ │ │ └─system.slice @2.078s
│ │ │ │ │ │ │ │ │ │ └─-.slice @2.081s
│ │ │ │ │ │ │ │ │ │ └─...
│ │ │ │ │ │ │ │ │ └─system.slice @2.078s
│ │ │ │ │ │ │ │ │ └─...
...
We get a full list of all the units, including those units which finished a timespan earlier than the last unit in the same level – which is what we retrieved before.
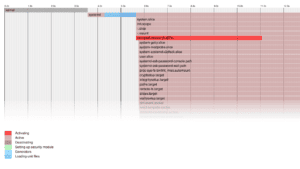
We can also request and store a vector SVG file with the systems that have been started and the time it took to initialize them:
$ systemd-analyze plot > unit_chain.svgThis will generate the SVG file and store it in unit_chain.svg. We might end up with a tall SVG file that contains all the units and the time it took to activate, deactivate, and load unit files… A section of an entire chain looks like this:

This is just a shortened example, but we can use the SVG file to visually inspect the entire chain of systemd in our system.
There’s one last thing that we can do with systemd-analyze. We can use the dot functionality of systemd-analyze to see the graph with the dependency relations:
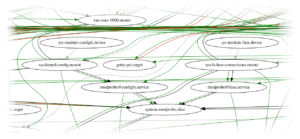
$ systemd-analyze dot | dot -Tsvg > dependency_graph.svgTo have human-readable and meaningful information, we need the dot command from GraphViz to generate an SVG file (thus, we use the -Tsvg flag). A region of the output file looks like this:

The color legend is printed after the command. Just in case, it’s shown here as well. Black means requires, dark blue means requisite, dark grey means wants, red means conflicts, and green means after.
This may look convoluted, but if we’re investigating a given unit or service, knowing its dependencies is useful.
We can also refer to systemctl to get information related to the systemd services of our system. The following commands require superuser rights (sudo) to get the most complete information. There’re two utilities that systemctl provides for this – let’s go through them!
The first command we can use is status to explore the services of the system:
$ sudo systemctl status
● hostname
State: degraded
Units: 326 loaded (incl. loaded aliases)
Jobs: 0 queued
Failed: 1 units
Since: Wed 2024-02-15 10:18:09 CET; 1 month 6 days ago
systemd: 253-1-arch
CGroup: /
├─init.scope
│ └─1 /usr/lib/systemd/systemd --system --deserialize 12
├─system.slice
│ ├─dbus.service
│ │ └─527 /usr/bin/dbus-daemon --system --address=systemd: --nofork -->
│ ├─polkit.service
│ │ └─681 /usr/lib/polkit-1/polkitd --no-debug
...
With status without any unit, we retrieve the runtime information about the whole system. We can also provide the name of a given unit, and the output will only display the information related to that unit:
$ sudo systemctl status slices.target
● slices.target - Slice Units
     Loaded: loaded (/usr/lib/systemd/system/slices.target; static)
     Active: active since Wed 2024-02-15 10:18:09 CET; 1 month 6 days ago
      Until: Wed 2024-02-15 10:18:09 CET; 1 month 6 days ago
       Docs: man:systemd.special(7)
Again, this is really helpful for debugging problems with services in Linux.
With the help of the command list-dependencies we can retrieve the units that are required and wanted by other units:
$ sudo systemctl list-dependencies
default.target
○ ├─display-manager.service
● └─multi-user.target
●   ├─dbus.service
●   ├─systemd-ask-password-wall.path
●   ├─systemd-logind.service
●   ├─systemd-user-sessions.service
●   ├─vpnagentd.service
●   ├─basic.target
...
This command will list only the units that are currently in the memory by the service manager. We can also refer to a specific unit like before:
$ sudo systemctl list-dependencies slices.target
slices.target
● ├─-.slice
● └─system.slice
This will return a more comprehensive list focused on a single unit.
As with everything in Linux, there’s a file or directory within the filesystem that contains information related to the services. We can use tree to explore it:
$ tree /etc/systemd/system
/etc/systemd/system
├── getty.target.wants
│   └── [email protected] -> /usr/lib/systemd/system/[email protected]
├── multi-user.target.wants
│   ├── remote-fs.target -> /usr/lib/systemd/system/remote-fs.target
│   └── vpnagentd.service -> /etc/systemd/system/vpnagentd.service
├── thinkfan.service.d
│   └── override.conf
└── vpnagentd.service
5 directories, 5 files
Within the /etc/systemd/system folder, we can see the services that are related to the local configuration. We can find the runtime units within /run/systemd/system and the units of those packages that we’ve installed under /usr/lib/systemd/system. These paths might change between distributions, but we can know their location with the systemd.unit manual.
In this article, we’ve talked about different ways we can explore the services of our system. We can rely on systemd-analyze to analyze critical units, the entire chain, and dependencies. With systemctl, we can check the status and list the dependencies. Finally, we can always check the units of our device by exploring the filesystem with tree.