

Learn through the super-clean Baeldung Pro experience:
>> Membership and Baeldung Pro.
No ads, dark-mode and 6 months free of IntelliJ Idea Ultimate to start with.
Learn through the super-clean Baeldung Pro experience:
>> Membership and Baeldung Pro.
No ads, dark-mode and 6 months free of IntelliJ Idea Ultimate to start with.
In Linux, processes require many resources like CPU, RAM, and disk space, but some processes also take significant network bandwidth resources. For example, video and audio streaming, gaming, real-time communication, IoT, and web crawling server processes are very network-intensive.
In this tutorial, we’ll discuss a few tools and methods to monitor the network usage per process.
NetHogs is a small ‘net top’ tool that allows monitoring network usage of a process running in the Linux system. Most common network monitoring tools break the traffic down per protocol or subnet, in contrast, nethogs groups bandwidth usage by process. So, this tool makes it easy to identify and terminate the programs that have run wild and are suddenly taking up our bandwidth.
NetHogs heavily relies on /proc, hence most features are only available on Linux. There is one subdirectory in the /proc directory for each process running on the system, which is named after the process ID or PID.
In Debian based machines we can:
$ sudo apt install nethogsIt is available with other package managers too in other distributions. We can also directly build and install from source on a local machine, but to perform so we should install development dependencies, ncurses for the text-based interface, and libpcap for user-level packet capture.
After the installation, we have to type sudo nethogs or normal nethogs for a root user (it won’t work without root privileges):
$ sudo nethogsThis command shows PID, username, process, network interface, and the download and upload speed. In the end, we can see the total traffic sent and received sorted in real-time.
Let’s see an example to make it more clear:
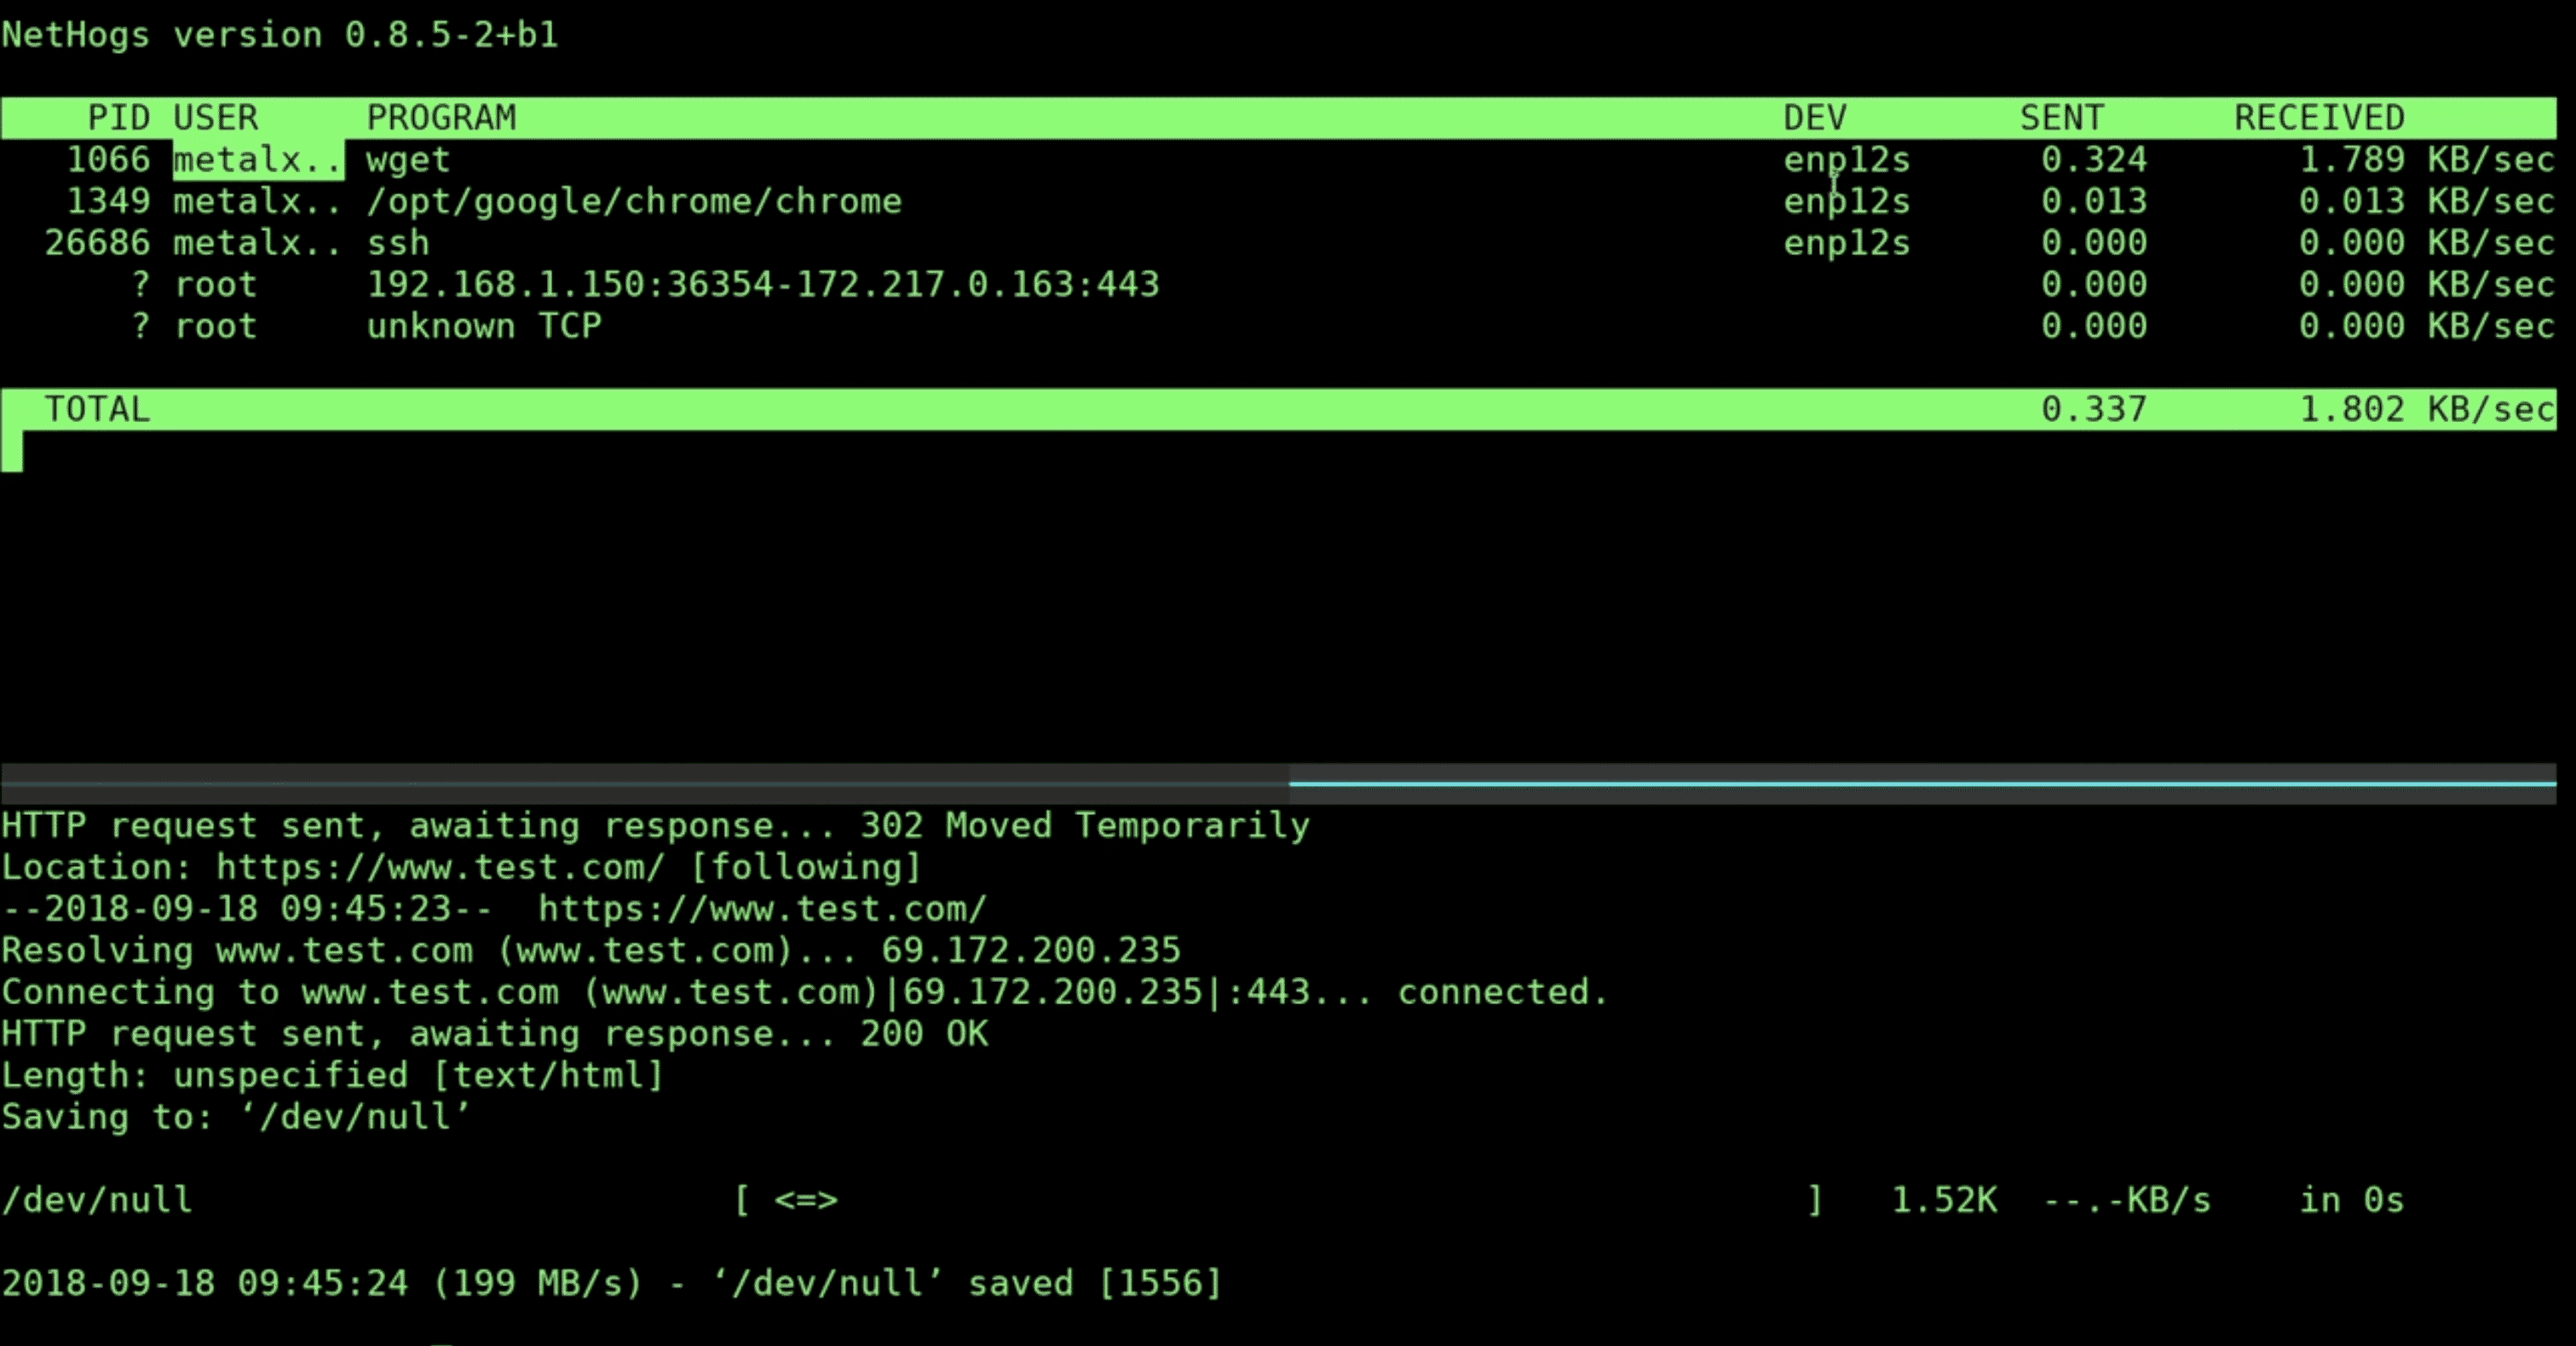
In the above example, when we execute the wget command, we can see that the wget process with PID “1066” is at the top of the list.
We can also use the -i option to detect traffic within a network per interface:
$ sudo nethogs wlan0In the above example, we can track traffic on wlan0. We can also view the network bandwidth of both wlan0 and wlan1 with:
$ sudo nethogs wlan0 wlan1Also, we can use the -p option to sniff the traffic in promiscuous mode, although it isn’t recommended:
$ sudo nethogs -p wlan0Similarly, with the -t option, we can see the output in trace mode:
$ sudo nethogs -t wlan0Another commonly used option is the -d option, with it we can provide the rate with which the tool will refresh its stats on the screen. The output is refreshed every second by default, here in the example below, we have set a delay of 3 seconds:
$nethogs -d 3In addition, the tool also has interactive controls:
We can use iftop to locate the TCP/UDP ports on the machine that is receiving the most traffic and then, use another network utility, netstat to locate the process that owns the port.
The iftop tool is an open-source command-line utility tool that displays the current bandwidth usage of a specific interface. Unfortunately, it doesn’t display the process which is using the bandwidth. However, we can use netstat, a tool that displays statistics of TCP and UDP protocol. With the port number, we can find out the process that is causing the problem.
Before anything else, we should start by installing libpcap and libncurses libraries using our package manager. Then iftop and net-tools (for netstat) can easily be installed using apt, yum, dnf, or any other package manager:
$ sudo apt install iftopLikewise, install net-tools:
$ sudo apt install net-toolsOnce installation is done, run the iftop command without any arguments to view the bandwidth usage of the default interface, it might need sudo or root privilege to capture on the device.
Let’s check the network usage with a base command and its output:
$ sudo iftop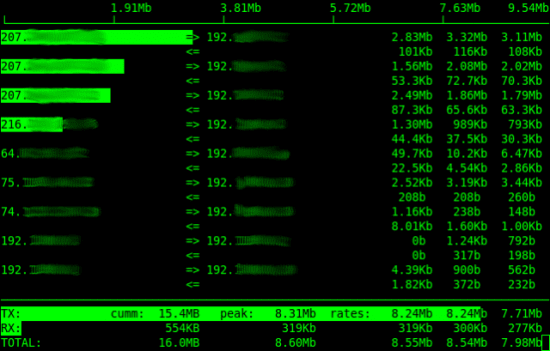
Here it shows the sent and received bytes in multiple time intervals. At the bottom, it displays cumulative sent and receives bytes.
We can specify an interface with the -i option:
$ sudo iftop -i eth0This command listens to network traffic on a named interface and displays a table of current bandwidth usage by pairs of hosts. By default, it sorts the connections per usage wise.
We can also use the -p option to view the port number:
$ sudo iftop -pThis displays the list of connections with their ports. For instance, if a connection on port 5432 is using significant bandwidth, we can easily find out process ID with the netstat command:
$ netstat -ltnup | grep ':5432'
(Not all processes could be identified, non-owned process info
 will not be shown, you would have to be root to see it all.)
tcp        0      0 0.0.0.0:22              0.0.0.0:*               LISTEN      2357
Here, as we can see, the process at port 5432 has PID 2357. There are many other techniques as well to find PID from the port, find out more about it here.
In this tutorial, we learned ways to sort processes regarding their network usage with the help of iftop and nethogs. We can reveal the issue and keep network traffic running by identifying processes or ports that are draining much of the network bandwidth.