Yes, we're now running our only Summer Sale. All Courses are 30% off until 20th July, 2026:
Difference Between Resident Set Size and Virtual Memory Size
Last updated: March 25, 2025

Learn through the super-clean Baeldung Pro experience:
>> Membership and Baeldung Pro.
No ads, dark-mode and 6 months free of IntelliJ Idea Ultimate to start with.
1. Overview
We sometimes need to check how much physical and virtual memory is consumed by the different processes and programs running on Unix-based systems.
In this short tutorial, we’ll explore this topic and determine how we can view the different processes running and their memory consumption estimates.
2. Understanding Resident Set Size and Virtual Memory Size
In modern Linux-based operating systems, each running process is allocated a virtual address space. This gives the process access to a big chunk of memory that may or may not be stored on the physical RAM on our computer.
We have two primary methods of measuring how much memory is consumed by a process:
- Resident Set Size (RSS)
- Virtual Memory Size (VSZ)
2.1. Resident Set Size
This is a measure of how much memory a process is consuming in our physical RAM, to load all of its pages after its execution.
This includes memory allocated from shared libraries, given they are still present in memory. Also, it includes all heap and stack memory.
RSS is not an accurate measure of the total memory processes are consuming, because it does not include memory consumed by libraries that were swapped out. On the other hand, the same shared libraries may be duplicated and counted in different processes. However, RSS is a reliable estimate.
2.2. Virtual Memory Size
This is a measure of much memory a process can access after its execution.
This includes swapped memory, the memory from external libraries, and allocated memory that’s not used.
Most modern Linux-based OSes utilize demand paging which means they only bring pages into memory once a program attempts to use them.
VSZ is not an accurate measure of how much memory is being consumed, but rather an estimation of the total amount of memory a process can consume within its life cycle.
3. Checking Memory Usage
Let’s look at the different tools we can use to check memory consumption estimates on our system.
3.1. With ps
We can use ps to check both RSS and VSZ:
$ ps aux

USER         PID %CPU %MEM    VSZ   RSS TTY      STAT START   TIME COMMAND
root        9326  0.0  0.0  25340  6560 ?        S    22:17   0:00 /lib/systemd/
root        9327  0.0  0.0  25340  6624 ?        S    22:17   0:00 /lib/systemd/
robert      9330  1.2  0.0  13408  5248 pts/0    Ss   22:17   0:00 bash
robert      9367  0.0  0.0  14024  3428 pts/0    R+   22:17   0:00 ps aux
Let’s break down our command to understand what every flag represents:
- a – displays processes from all users
- u – displays the specific user of each process
- x – displays all processes not attached to a terminal, these include services such as crond or upowerd
From the above output, we can deduce that the RSS column represents the resident set size and the VSZ column represents the virtual memory size in kilobytes.
Furthermore, we can display information from specific processes such as chrome:
$ ps eo user,pid,vsz,rss $(pgrep -f 'chrome')

USER PID VSZ RSS
robert 4930 16799892 3044
robert 4932 16790656 3032
robert 4938 17043484 55648
robert 4940 17043484 56072
We are querying to retrieve only specific information about all chrome processes currently running.
3.2. With top
We can also use top to check both RSS and VSZ. One big advantage of using top is that it keeps checking for changes in the list of processes. This allows us to see changes to RSS and VSZ in real-time:
$ top

top - 11:49:22 up 14:02, 1 user, load average: 0.76, 1.08, 1.22
Tasks: 350 total, 1 running, 349 sleeping, 0 stopped, 0 zombie
%Cpu(s): 3.1 us, 1.9 sy, 0.0 ni, 94.9 id, 0.0 wa, 0.0 hi, 0.1 si, 0.0 st
MiB Mem : 7824.8 total, 357.5 free, 4540.5 used, 2926.8 buff/cache
MiB Swap: 2048.0 total, 2036.8 free, 11.2 used. 2523.1 avail Mem

 PID USER PR NI VIRT RES SHR S %CPU %MEM TIME+ COMMAND
6950 robert 20 0 28.4g 390040 123940 S 2.6 4.9 11:29.00 chrome
13899 robert 20 0 14664 4344 3380 R 1.0 0.1 0:01.12 top
1 root 20 0 171648 15644 8244 S 0.7 0.2 0:11.78 systemd
1499 mysql 20 0 2143012 384564 34492 S 0.7 4.8 0:20.74 mysqld
5241 robert 20 0 16.3g 129584 92836 S 0.7 1.6 1:16.78 chrome
The first part of the output shows a lot of useful information such as the total number of processes running, number of available users, and RAM and swap memory information.
The second portion of the output displays all processes running and their respective values from the columns. The column VIRT, represents VSZ, while the column RES represents RSS.
The values returned update in real-time so they will change after every other second. These values are not an accurate measure of how much memory is actually being consumed by the running processes, but it is a reliable estimate.
3.3. With htop
htop is another useful tool we could use to monitor memory usage. Similar to top, htop also shows us real-time information. It is available in most Linux and Debian OS. Let’s install it:
$ sudo apt-get install htopAfter installation, we can type in this command to view memory usage information.
$ htopWe get this output:
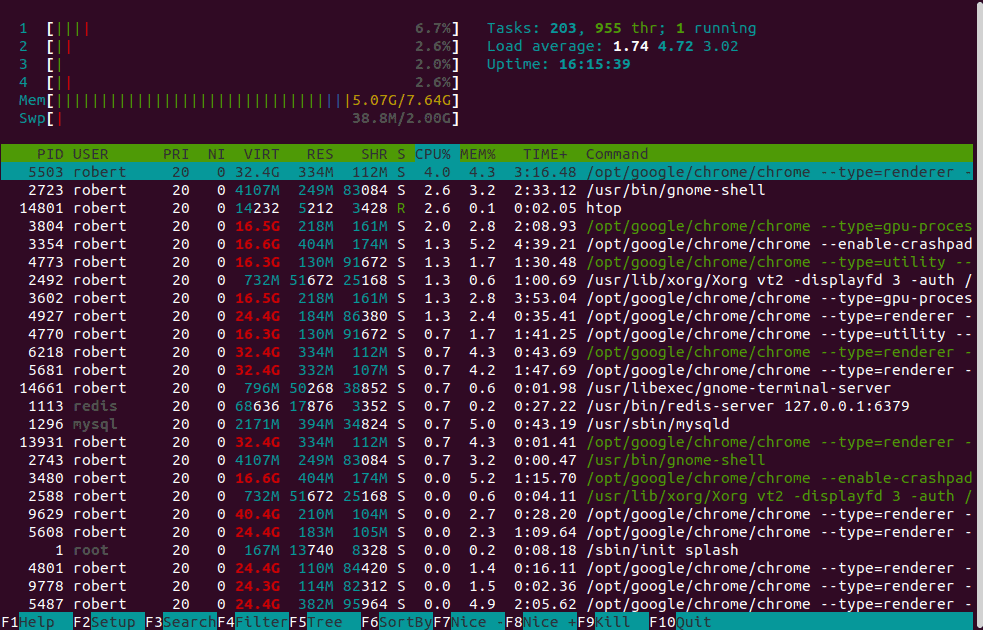
This gives us a lot of real-time information about all the processes running. It also shows us system-specific information such as load average and uptime.
4. Conclusion
In this article, we’ve looked at how memory is allocated for different processes. We’ve also explored some of the different tools we can use to check both RSS and VSZ values.
Finally, we looked at how to query for all processes running that belong to a specific program.