

Learn through the super-clean Baeldung Pro experience:
>> Membership and Baeldung Pro.
No ads, dark-mode and 6 months free of IntelliJ Idea Ultimate to start with.
Learn through the super-clean Baeldung Pro experience:
>> Membership and Baeldung Pro.
No ads, dark-mode and 6 months free of IntelliJ Idea Ultimate to start with.
In this tutorial, we’ll cover some terminal commands and third-party add-ons to help us find the resource usage by each process.
Linux offers several different commands to check system resource usage. The most prevalent ones we will cover today are top and pidstat.
Usually, we can use the Linux built-in top command. This command displays a real-time view of a running system in the command prompt. If we want to have an idea of a single process, we can use the -p parameter.
When using the -p parameter, we often want to include the process id. We can find the process id of a named process using the ps command. Once we find the process id, we can feed the number into the top command in this manner:
$ top -p 2225
top - 15:47:16 up 24 min,  2 users,  load average: 0.30, 0.12, 0.11
Tasks:  1 total,  0 running,  1 sleeping,  0 stopped,  0 zombie
%Cpu(s):  0.3 us,  0.2 sy,  0.0 ni, 99.5 id,  0.0 wa,  0.0 hi,  0.0 si,  0.0 st
KiB Mem :  8174276 total,  6455164 free, 862340 used, 856776 buff/cache
KiB Swap:  8257532 total,  8257532 free,      0 used, 6986028 avail Mem

 PID    USER        PR   NI       VIRT       RES      SHR    S   %CPU   %MEM      TIME+    COMMAND
2225    fcsvmus+    20    0    3299032    194052    72816    S    0.3    2.4    0:53.48    gnome-shell
The shell will refresh this screen once every a couple of seconds to give us an updated view of a process’ status. However, the display is not very user-friendly. We probably need to use some third-party add-ons to provide a better idea.
Linux offers another command named pidstat to check the percentage of resources being used. However, it only gives us a snapshot of current resource usage when we run this command, rather than providing a real-time view as we can expect from the top command. On the other hand, this makes this command a lightweight process.
This command is part of the sysstat package, which is not vanilla Linux, but we can still find the documentation of this command on the man page. We should install this package first using this command:
$ sudo snap install sysstat
After installing this package, we can use the included pidstat command to do our bidding. If we don’t know the process id we are looking for, we need first to use the ps command to find that number. Here is how we shall use the pidstat command:
$ ps aux
USER             PID %CPU %MEM    VSZ   RSS TTY      STAT START   TIME COMMAND
...
username        2888  0.0  0.0  10616  4948 pts/0    Ss   21:10   0:00 bash
...

$ pidstat --human -p 2888
Linux 5.13.0-40-generic (username-VirtualBox) 	2022-04-29 	_x86_64_	(4 CPU)

09:15:18 PM   UID       PID    %usr %system  %guest   %wait    %CPU   CPU  Command
09:15:18 PM  1000      2888    0.0%    0.0%    0.0%    0.0%    0.0%     3  bash
The –human parameter will display the percentage numbers in a ‘*.*%” style. Without this parameter, it will only display the digits instead.
Linux offers us some handy commands to obtain a view of system resource usage of specific tasks. However, they can only display the numbers in the command prompt. If we want to see a gradual change in resource usage in a human-readable form, we need to rely on some third-party add-ons to plot graphs.
The following add-ons require both Python and pip installed on the Linux machine. Once we have both of these installed on our machine, we can use pip to install these packages and monitor the resource usage of a particular process.
psrecord records the usage of CPU and Memory usage via the psutil library. It’s straightforward to use on our Linux system.
We can type this command in the command prompt to install this applet:
$ pip install psrecord
After we have psrecord successfully installed. We need to find the process id via the built-in ps command first:
$ ps aux
USER         PID %CPU %MEM     VSZ    RSS TTY    STAT START   TIME COMMAND
...
username   24110  9.5  2.1 3229940 347564 ?      Sl   15:24   4:02 /usr/lib/firefox/firefox -private-window
...
After we find the process id of our interest, we call psrecord to record the resource usage of this process and plot the data into an image file:
$ psrecord 24110 --interval 1 --duration 10 --plot 24110.png
Here, we specify the psrecord to monitor the process for a duration of 10 seconds and take a record once every 1 second.
If the system processes this command correctly, an image named “24110.png” will appear in the current directory:
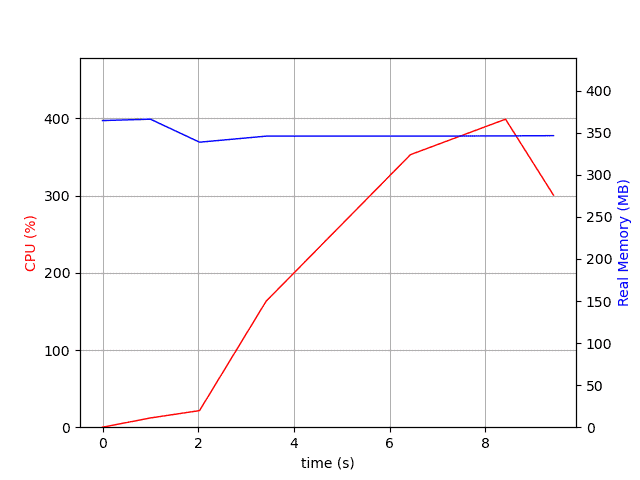
There is an error in the CPU percentage as the decimal point is moved one digit to the right, making the CPU usage over 100% capacity. The truth is the CPU percentage for this process is only around 20% if we check again with the top command.
Some may ask us how we will be monitoring the resource usage if we do not know the process id. Luckily we can use another Python applet called memory_profiler to monitor the memory usage. Note that this applet checks memory usage only.
We can use pip to install this applet:
$ pip install memory_profiler
Once this applet is installed, we can use this command to monitor a process utilizing the executable’s directory. Here we only use bash as an example:
$ mprof run bashAfter we run this command, the memory_profiler will generate a .dat file in our current directory. We don’t need to specify the file for memory_profiler as it will search available files on its own. All we need to do now is tell memory_profiler to draw a diagram for us.
Therefore, all we need to do at this step is to type the following command in the command prompt:
$ mprof plotAfter we type this command, a window under Matplotlib will appear, showing the memory usage of the bash process. Then, we can choose to save the diagram as an image to our local end:
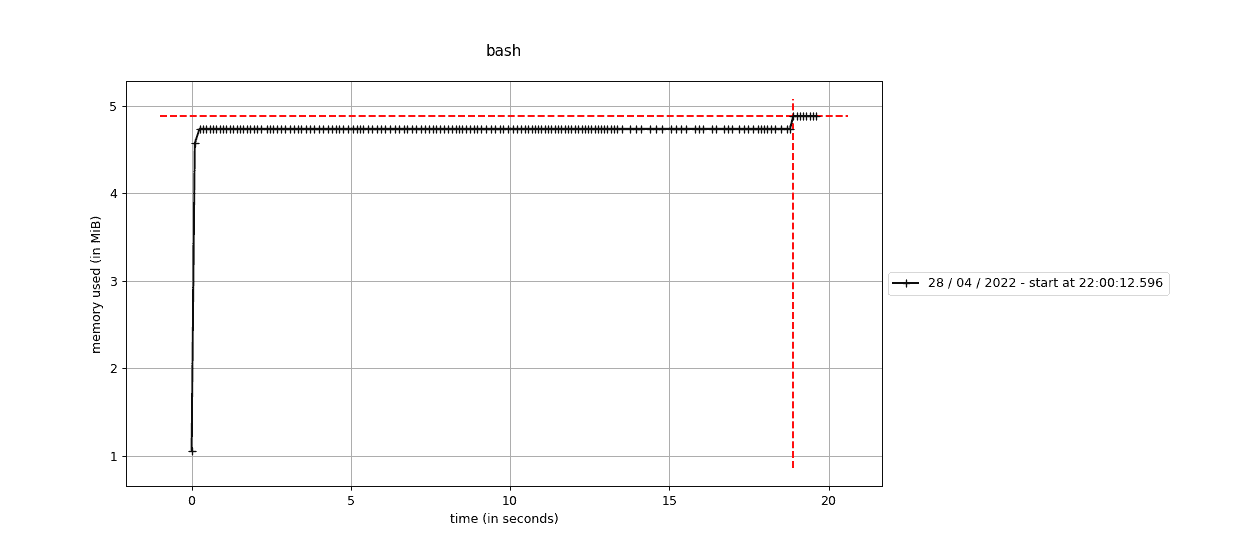
Please note that memory_profiler does not support CPU performance monitoring. Therefore, if we want to check the CPU usage, we need to use other tools.
Through Python, we can easily find a better way to measure the resource usage of a process. There should exist other add-ons written and compiled in different languages, and we will cover them in later articles.
There are multiple ways to view and access the system resource usage in the Linux system. They can be classified into two different approaches:
If we want to keep our system clean with minimum installation, we recommend using integrated commands. Otherwise, these third-party add-ons are better choices because they offer us a better experience.