

Learn through the super-clean Baeldung Pro experience:
>> Membership and Baeldung Pro.
No ads, dark-mode and 6 months free of IntelliJ Idea Ultimate to start with.
Last updated: November 26, 2022
Learn through the super-clean Baeldung Pro experience:
>> Membership and Baeldung Pro.
No ads, dark-mode and 6 months free of IntelliJ Idea Ultimate to start with.
As Linux users, we often want to identify the total number of running processes on the system. Additionally, sometimes we might want to investigate what a particular program or command is doing. To achieve that, we can rely on different tools such as htop and ps.
In this tutorial, we will check the output of these commands while we monitor processes and threads.
htop is an interactive tool that allows us to view and manage the running processes and threads in real-time. It is also a very useful command to monitor system resources such as CPU and memory usage.
Let's see how we can install this utility on Ubuntu/Debian and CentOS respectively.
For Ubuntu/Debian:
$ sudo apt install htopFor CentOS:
$ yum install epel-release
$ yum install htop
$ htop -v
htop 2.2.0 - (C) 2004-2019 Hisham Muhammad
Released under the GNU GPL.
In the next sections, we will be working with version 2.2.0 of htop.
Both htop and ps are process managers. Let's see what they show by default for a specific process.
With htop, we can limit the output to a specific process ID from the command line. To illustrate the problem at hand, let's pass the MariaDB server process ID as the value to the --pid option:
$ htop --pid=$(pidof mysqld)
1  [||                                                             2.6%]   Tasks: 51, 43 thr; 2 running
2  [                                                               0.0%]   Load average: 0.00 0.02 0.05 Mem[|||||||||||||||||||||||||||||||||||||||||||||             397M/991M]   Uptime: 04:45:44
Swp[                                                           0K/2.00G]

PID USER      PRI  NI  VIRT   RES   SHR S CPU% MEM%   TIME+  Command
17173 mysql      20   0  948M 88316  7108 S  0.7  8.7  0:00.73 /usr/libexec/mysqld --basedir=/usr --datadir=/data/lib/mysql --plugin-dir=/usr/lib64/mysql/
17184 mysql      20   0  948M 88316  7108 S  0.0  8.7  0:00.03 /usr/libexec/mysqld --basedir=/usr --datadir=/data/lib/mysql --plugin-dir=/usr/lib64/mysql/
17177 mysql      20   0  948M 88316  7108 S  0.0  8.7  0:00.03 /usr/libexec/mysqld --basedir=/usr --datadir=/data/lib/mysql --plugin-dir=/usr/lib64/mysql/
...
17193 mysql      20   0  948M 88316  7108 S  0.0  8.7  0:00.00 /usr/libexec/mysqld --basedir=/usr --datadir=/data/lib/mysql --plugin-dir=/usr/lib64/mysql/
17202 mysql      20   0  948M 88316  7108 S  0.0  8.7  0:00.00 /usr/libexec/mysqld --basedir=/usr --datadir=/data/lib/mysql --plugin-dir=/usr/lib64/mysql/
17203 mysql      20   0  948M 88316  7108 S  0.0  8.7  0:00.00 /usr/libexec/mysqld --basedir=/usr --datadir=/data/lib/mysql --plugin-dir=/usr/lib64/mysql/


F1Help  F2Setup F3Search F4Filter F5Tree F6SortByF7Nice -F8Nice +F9Kill  F10Quit
Here, we use the pidof command to find the PID of the running MariaDB program name. Then, using command substitution, we replace the pidof mysqld command with its actual output.
On the other hand, let's combine the grep command with ps to filter the output based on the mysqld process ID:
$ ps -e -o pid,user,command | grep $(pidof mysqld) | grep -v grep
17173 mysql    /usr/libexec/mysqld --basedir=/usr --datadir=/data/lib/mysql --plugin-dir=/usr/lib64/mysql/plugin --log-error=/data/lib/mysql/log/mariadb.log --pid-file=/data/lib/mysql/run/mariadb.pid --socket=/data/lib/mysql/mysql.sock
In the above, we pass the -e option to ps to select all the processes and the -o option to print only certain fields. In addition, we use the grep command with the -v option to exclude grep itself from the final output.
We notice that htop displays more processes compared to the ps output. In the next section, we will discuss the output that we just obtained.
It turns out that both htop and ps read the details about the number of the running processes and threads from the /proc filesystem. More specifically, the /proc/<pid> directory and the subdirectories /proc/<pid>/task/<tid> found underneath.
Let's list and count the subdirectories under /proc/<pid>/task/, replacing <pid> with the running MariaDB Server PID:
$ ls /proc/$(pidof mysqld)/task
17173  17177  17178  17179  17180  17181  17182  17183  17184  17185  17186  17188  17189  17190  17191  17192  17193  17202  17203
$ ls -1 /proc/$(pidof mysqld)/task | wc -l
19
We deduce from the above output that, unlike ps, the htop command displays the running processes and their corresponding individual threads by default.
htop was designed to provide as much information as possible about what's going on in the system. As a result, it displays the user threads instead of hiding them. For example, system administrators can spot a problem in a multithreaded application while monitoring the CPU usage of its related threads. Yet, some Linux users prefer to disable this setting as they find it less useful to show all the threads in the htop output.
In Linux, we have user-space and kernel-space threads. The user threads are associated with a user application, and the kernel threads are created and managed by the OS.
htop, by default, displays the user threads and hides the kernel threads. Next, let's check how we can modify this behavior.
We can customize the htop configuration to disable the user threads' visibility. To demonstrate that, we execute htop --pid=$(pidof mysqld), then:
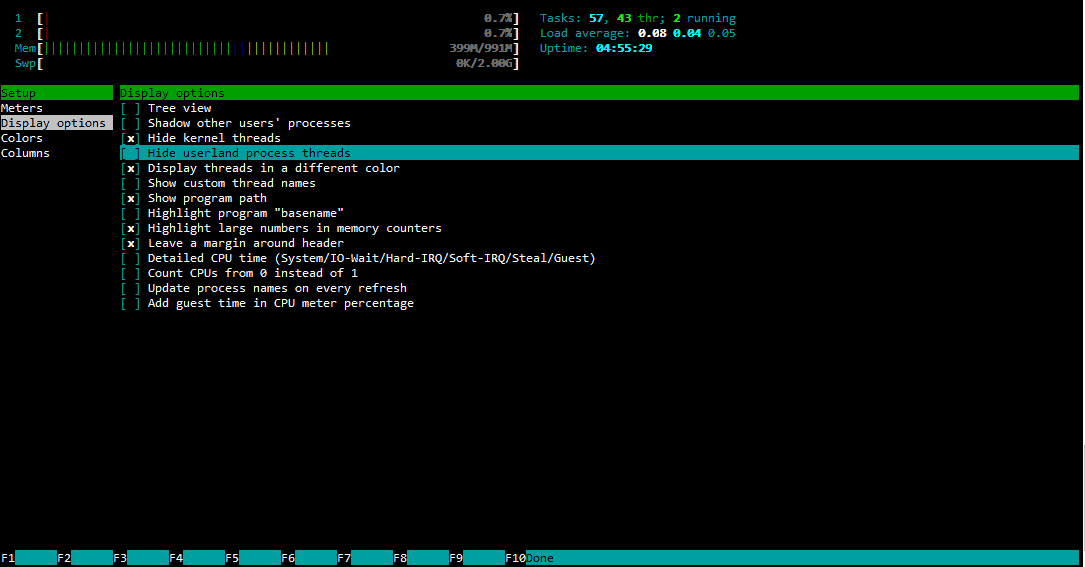
Likewise, we can simply press H to hide the user threads.
Following the above change, we limit the output to the main MariaDB process only:
PPID   PID USER      PRI  NI  VIRT   RES   SHR S CPU% MEM%   TIME+  Command
17007 17173 mysql      20   0  948M 88316  7108 S  0.7  8.7  0:01.07 /usr/libexec/mysqld --basedir=/usr --datadir=/data/lib/mysql --plugin-dir=/usr/lib64/
Now we see the same process that ps shows us. Further, let's explore another comparison point between the two process managers.
Starting from version 2.2.0, htop identifies the kernel threads by checking if /proc/<pid>/cmdline is empty. However, the latest htop release detects the kernel threads based on the PF_KTHREAD bit value inside the /proc/<pid>/stat.
We can list the kernel threads which are disabled by default. First of all, let's launch htop and then add a new column:
Next, let's hit K:
PPID   PID USER      PRI  NI  VIRT   RES   SHR S CPU% MEM%   TIME+  Command
    2 20265 root       20   0     0     0     0 S  0.7  0.0  0:00.08 kworker/1:1
17007 17173 mysql      20   0  948M 88316  7108 S  0.0  8.7  0:01.17 /usr/libexec/mysqld --basedir=/usr --datadir=/data/lib/mysql --plugin-dir=/usr/lib64/
17007 17182 mysql      20   0  948M 88316  7108 S  0.0  8.7  0:00.06 /usr/libexec/mysqld --basedir=/usr --datadir=/data/lib/mysql --plugin-dir=/usr/lib64/
...
    2    14 root       20   0     0     0     0 S  0.0  0.0  0:00.18 ksoftirqd/1
    2    16 root        0 -20     0     0     0 S  0.0  0.0  0:00.00 kworker/1:0H
    2    18 root       20   0     0     0     0 S  0.0  0.0  0:00.00 kdevtmpfs
From the above, we also see the kernel threads. For example, kworker/0:0H with PPID=2 (Kthreadd as the parent process).
Furthermore, the top right part of the htop output shows some useful information about the total running processes:
Tasks: 53, 43 thr, 78 kthr; 2 runningThis means that according to htop, we have 53 total processes, 43 user threads, 78 kernel threads, and 2 tasks in the running state. Let's compare that with ps.
We can modify the default ps output to show details about not only processes but also threads. To select all the processes and show the threads, we can pass the -eLf flags to the ps command.
As an illustration, let's limit our output to the first 5 mysqld threads while still preserving the header names:
$ ps -eLf | head -n 1 ; ps -eLf | grep $(pidof mysqld) | head -n 5
UID PID PPID LWP C NLWP STIME TTY TIME CMD
mysql 17173 17007 17173 0 19 13:30 ? 00:00:00 /usr/libexec/mysqld --basedir=/usr --datadir=/data/lib/mysql --plugin-dir=/usr/lib64/mysql/plugin --log-error=/data/lib/mysql/log/mariadb.log --pid-file=/data/lib/mysql/run/mariadb.pid --socket=/data/lib/mysql/mysql.sock
mysql 17173 17007 17177 0 19 13:30 ? 00:00:00 /usr/libexec/mysqld --basedir=/usr --datadir=/data/lib/mysql --plugin-dir=/usr/lib64/mysql/plugin --log-error=/data/lib/mysql/log/mariadb.log --pid-file=/data/lib/mysql/run/mariadb.pid --socket=/data/lib/mysql/mysql.sock
mysql 17173 17007 17178 0 19 13:30 ? 00:00:00 /usr/libexec/mysqld --basedir=/usr --datadir=/data/lib/mysql --plugin-dir=/usr/lib64/mysql/plugin --log-error=/data/lib/mysql/log/mariadb.log --pid-file=/data/lib/mysql/run/mariadb.pid --socket=/data/lib/mysql/mysql.sock
mysql 17173 17007 17179 0 19 13:30 ? 00:00:00 /usr/libexec/mysqld --basedir=/usr --datadir=/data/lib/mysql --plugin-dir=/usr/lib64/mysql/plugin --log-error=/data/lib/mysql/log/mariadb.log --pid-file=/data/lib/mysql/run/mariadb.pid --socket=/data/lib/mysql/mysql.sock
mysql 17173 17007 17180 0 19 13:30 ? 00:00:00 /usr/libexec/mysqld --basedir=/usr --datadir=/data/lib/mysql --plugin-dir=/usr/lib64/mysql/plugin --log-error=/data/lib/mysql/log/mariadb.log --pid-file=/data/lib/mysql/run/mariadb.pid --socket=/data/lib/mysql/mysql.sock
In the above example, we combine the -Lf options to add the LWP (thread ID) and NLWP (number of threads) columns. The NLWP column shows that we have 19 mysqld threads.
Finally, we can view and count the number of kernel threads by passing the --ppid and -p options to select based on parent process ID and process ID, respectively:
$ ps  --ppid 2 -p 2 --format pid,ppid,time,cmd
  PID  PPID     TIME CMD
    2     0 00:00:00 [kthreadd]
    4     2 00:00:00 [kworker/0:0H]
    6     2 00:00:00 [ksoftirqd/0]
    7     2 00:00:00 [migration/0]
    8     2 00:00:00 [rcu_bh]
    9     2 00:00:01 [rcu_sched]
   10     2 00:00:00 [lru-add-drain]
   11     2 00:00:00 [watchdog/0]
   ...
  6570     2 S 00:00:00 [kworker/1:0]
  25359    2 S 00:00:00 [kworker/0:0]
 25761     2 S 00:00:00 [kworker/1:2]
 26957     2 S 00:00:00 [kworker/0:2]
In this case, we use the --format flag to specify the columns.
From the above output, we list the kernel threads kthreadd (PID=2) and all its children (PPID=2).
Lastly, let's count the total number of kernel threads as we did with htop:
$ ps --ppid 2 -p 2 --format pid,ppid,state,time,cmd | tail -n +2 | wc -l
78
We use the tail command to skip counting the first column headers.
As shown above, the number of kernel threads displayed with the ps command is identical to the number of kthr displayed by htop.
In this article, we have discussed both the htop and the ps commands. However, we have primarily focused on comparing their respective outputs. To answer our main question, we have seen how to modify the output of both commands to obtain the same number of processes and threads.