

Mocking is an essential part of unit testing, and the Mockito library makes it easy to write clean and intuitive unit tests for your Java code.
Get started with mocking and improve your application tests using our Mockito guide:
Handling concurrency in an application can be a tricky process with many potential pitfalls. A solid grasp of the fundamentals will go a long way to help minimize these issues.
Get started with understanding multi-threaded applications with our Java Concurrency guide:
Spring 5 added support for reactive programming with the Spring WebFlux module, which has been improved upon ever since. Get started with the Reactor project basics and reactive programming in Spring Boot:
Since its introduction in Java 8, the Stream API has become a staple of Java development. The basic operations like iterating, filtering, mapping sequences of elements are deceptively simple to use.
But these can also be overused and fall into some common pitfalls.
To get a better understanding on how Streams work and how to combine them with other language features, check out our guide to Java Streams:
Explore Spring Boot 3 and Spring 6 in-depth through building a full REST API with the framework:
Yes, Spring Security can be complex, from the more advanced functionality within the Core to the deep OAuth support in the framework.
I built the security material as two full courses - Core and OAuth, to get practical with these more complex scenarios. We explore when and how to use each feature and code through it on the backing project.
You can explore the course here:
Spring Data JPA is a great way to handle the complexity of JPA with the powerful simplicity of Spring Boot.
Get started with Spring Data JPA through the guided reference course:
Refactor Java code safely — and automatically — with OpenRewrite.
Refactoring big codebases by hand is slow, risky, and easy to put off. That’s where OpenRewrite comes in. The open-source framework for large-scale, automated code transformations helps teams modernize safely and consistently.
Each month, the creators and maintainers of OpenRewrite at Moderne run live, hands-on training sessions — one for newcomers and one for experienced users. You’ll see how recipes work, how to apply them across projects, and how to modernize code with confidence.
Join the next session, bring your questions, and learn how to automate the kind of work that usually eats your sprint time.
1. Introduction
As application developers, we generally build complex business logic as efficiently as possible. However, once these applications are in production, we would also like to gather runtime statistics on the application performance to help with further improvements and troubleshooting.
Application logging may be an option, but that still will not give a complete picture of an application’s performance. For this purpose, we need to use some tools for gathering runtime statistics and monitoring.
In this article, we take a quick look at one such library – JavaMelody. We’ll explore its advantages and see how it’s an efficient solution for monitoring Java applications. We’ll also cover the installation and some fundamental operations.
2. Key Features
JavaMelody is an embeddable open-source library offering monitoring capabilities for Java applications. It’s lightweight and easy to integrate.
The library’s main goal is to provide a way to measure and calculate statistics on real-time operations in QA and production environments. It focuses on gathering and visualizing statistics to help make informed decisions and improve application performance.
Some of its key features include:
- Comprehensive Monitoring: JavaMelody tracks various data points such as HTTP requests, SQL queries, CPU usage, used memory, and more, for performance analysis.
- Performance Insights: It provides data on several useful metrics such as average response times, execution counts, and error percentages, thus aiding in identifying performance bottlenecks and root causes of delays.
- Trend Charts: Evolution charts show indicators like execution numbers, response times, memory usage, CPU load, and user sessions over customizable time frames. This allows system administrators to look back in time and aids root cause analysis in case of issues.
- Error and Warning Tracking: Monitors HTTP errors, log warnings, and SQL errors.
- Optional Collect Server: JavaMelody can optionally be set up to centralize data from multiple applications or multiple instances of the same application. This is especially useful in clustered environments as it allows for offloading storage and report generation to a separate server.
3. Installation and Setup
The installation and setup of JavaMelody is quite simple for most scenarios. JavaMelody also has several plugin options for working with tools like Jenkins, Spring Boot, and Atlassian’s Jira. Here, we consider the typical setup for a Java Web Application Archive (.war).
3.1. Add Dependencies
First, we need to add the javamelody-core JAR dependency to our Maven project in the pom.xml:
<dependency>
    <groupId>net.bull.javamelody</groupId>
    <artifactId>javamelody-core</artifactId>
    <version>2.2.0</version>
</dependency>
We can also do this by simply adding the javamelody.jar and jrobin-1.5.9.jar into the WEB-INF/lib directory for projects which do not use a dependency management tool like Maven.
Additional dependencies may be required for certain options such as PDF report generation. We can find relevant information pertaining to these dependencies in the JavaMelody user guide.
3.2. Configure web.xml
For most modern Java Web Applications, this step is not needed. By modern, we mean applications using Servlet 3.0 or higher in the web.xml and a compatible Application Server (such as Tomcat 7.0 and higher).
If we’re using an older servlet version or if the web.xml does not mention version=”3.0″, then we’ll need to add the JavaMelody filter to our web.xml:
<filter>
    <filter-name>javamelody</filter-name>
    <filter-class>net.bull.javamelody.MonitoringFilter</filter-class>
    <async-supported>true</async-supported>
</filter>
<filter-mapping>
    <filter-name>javamelody</filter-name>
    <url-pattern>/*</url-pattern>
    <dispatcher>REQUEST</dispatcher>
    <dispatcher>ASYNC</dispatcher>
</filter-mapping>
<listener>
    <listener-class>net.bull.javamelody.SessionListener</listener-class>
</listener>
Note that <async-supported>true</async-supported> and <dispatcher>ASYNC</dispatcher> are needed to support asynchronous requests with Servlet API 3.0.
3.3. Accessing the Monitoring Dashboard
We’ve now deployed the application with the JAR file dependencies and web.xml configuration. We can find the monitoring dashboard immediately at the URL:
http://<host>:<port>/<context>/monitoringOf course, we need to replace <host>, <port>, and <context> with values appropriate to our application.
3.4. Other Configuration and Advanced Topics
So far, we’ve only covered the basic setup of JavaMelody. It offers several other ways to configure such as plugins for Spring Boot, Jira, Jenkins, Bamboo, Sonar, and Liferay, as outlined in the documentation.
There are also several other configuration options such as JDBC monitoring, PDF report generation, email reports, batch job monitoring (Quartz), and many more. The specifics of these configuration options are beyond the scope of this article. However, depending on our specific application requirements, we may need to explore these options.
4. Security
So far, we haven’t discussed anything about the security of the monitoring URL. The JavaMelody monitoring page does not contain any passwords. Even so, we see the JavaMelody monitoring URL exposes a lot of usage information about the Application APIs, and therefore, the URL must be secured in Production environments.
For many environments such as Jenkins, JIRA, Confluence, Bamboo, or Liferay plugins, we can do this by using the inbuilt app roles.
Existing role-based security available in the application can usually be extended to secure the JavaMelody monitoring page. We want that only the users with specific roles can access this URL. To achieve this we set up a monitoring role and secure the URI /monitoring. There are many ways to do this. We can choose the way that is most appropriate for our application.
In this example, we consider Basic Authentication using Tomcat. First, we need to set up Basic Authentication for the /monitoring URL in the web.xml:
<login-config>
    <auth-method>BASIC</auth-method>
    <realm-name>Monitoring</realm-name>
</login-config>
<security-role>
    <role-name>monitoring</role-name>
</security-role>
<security-constraint>
    <web-resource-collection>
        <web-resource-name>Monitoring</web-resource-name>
        <url-pattern>/monitoring</url-pattern>
    </web-resource-collection>
    <auth-constraint>
        <role-name>monitoring</role-name>
    </auth-constraint>
    <!-- if SSL enabled (SSL and certificate must then be configured in the server)
    <user-data-constraint>
        <transport-guarantee>CONFIDENTIAL</transport-guarantee>
    </user-data-constraint>
    -->
</security-constraint>
Next, we define the realm and the users in the application server. The users must have the “monitoring” role to have access to the reports. For example, if we use Tomcat with the default realm, we can modify the content of the conf/tomcat-users.xml file:
<tomcat-users>
    <role rolename="monitoring"/>
    <user username="monitoring" password="monitoring" roles="monitoring"/>
</tomcat-users>
Additional security information is available in the library’s user guide.
5. Performance Overhead
It has been noted that JavaMelody has minimal performance overhead. This makes it suitable for continuous use in production environments.
Unlike other monitoring tools, it only monitors statistics rather than profiling. This allows for avoiding the heavy instrumentation and database logging typical of other monitoring tools. This low-touch monitoring approach leads to low CPU, memory, and I/O usage. JavaMelody collects many statistics including HTTP, JDBC, and optional Spring/EJB3.
Additionally, JavaMelody can be centralized for larger applications further reducing local memory and storage demands. We can review this discussion to appreciate some points about the performance overheads of JavaMelody. However, when using it in our applications, it’s important to check performance statistics on Pre-Production environments before promoting the configuration to production.
6. Usage and Screenshots
Now, we have the necessary configuration in place. We can check the /monitoring URI and get a view of several charts. Let’s explore a few sample screenshots to get a general idea of the capabilities.
We note that the layout of the monitoring UI is such that it’s best viewed on a wide-screen device such as a Desktop or a Laptop:
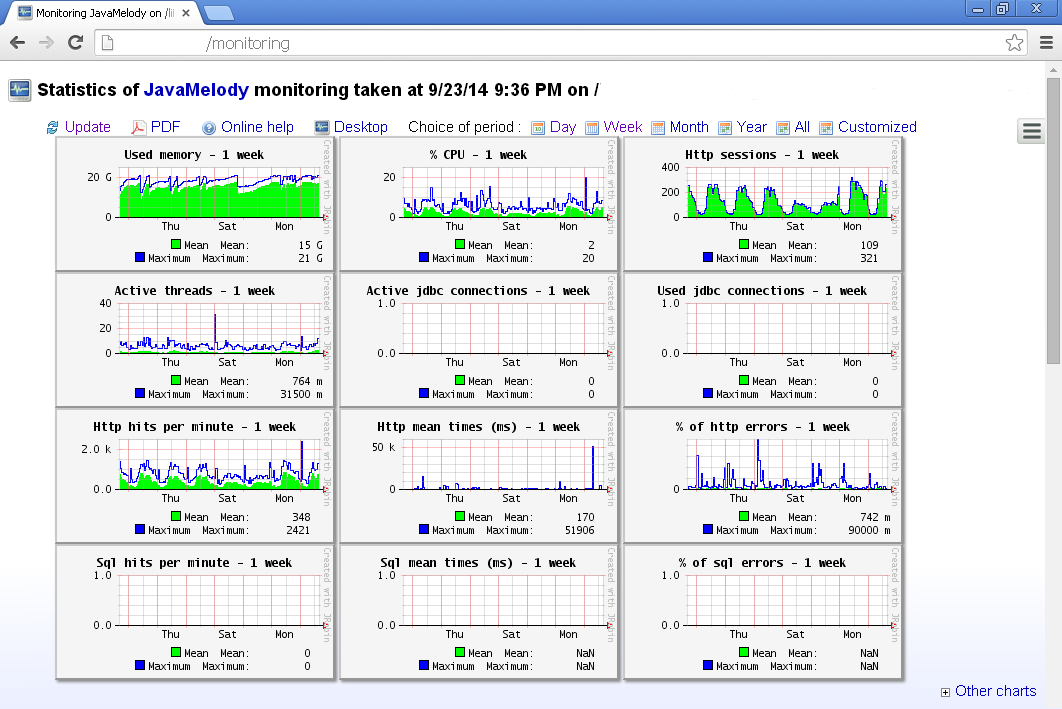
6.1. Sample Statistics
The various charts give application monitoring personnel an immediate snapshot of the application performance over the past week. As a monitoring user, we can further click on any chart and zoom in on the details to get a close view.
As an example, let’s look at a zoomed-in view of the HTTP sessions through one day:

This view shows a clear picture of times in the day when there was higher usage of the application. In this case, the number of application users increased quickly from about 7:00 am to 9:00 am. Then, there was some variance throughout the day and late evening.
We also observe a gradual decrease in the number of users from 00:30 hours to 4:30 hours. When compared with several days, these graphs offer a view into usage patterns and also help surface any anomalies.
Another important statistical view is the view of HTTP statistics:

This example presents the GET API with URI /admin/globalusage.action as the one with a large average response time compared to the other API calls. This helps us identify the API calls that need the most attention from the application performance perspective and helps drive the non-functional requirements roadmap for our products.
There are many other views, and a detailed description of those is beyond the scope of this article. All the above images are a part of the JavaMelody wiki page. We can find several other example screenshots there.


