

Mocking is an essential part of unit testing, and the Mockito library makes it easy to write clean and intuitive unit tests for your Java code.
Get started with mocking and improve your application tests using our Mockito guide:
Handling concurrency in an application can be a tricky process with many potential pitfalls. A solid grasp of the fundamentals will go a long way to help minimize these issues.
Get started with understanding multi-threaded applications with our Java Concurrency guide:
Spring 5 added support for reactive programming with the Spring WebFlux module, which has been improved upon ever since. Get started with the Reactor project basics and reactive programming in Spring Boot:
Since its introduction in Java 8, the Stream API has become a staple of Java development. The basic operations like iterating, filtering, mapping sequences of elements are deceptively simple to use.
But these can also be overused and fall into some common pitfalls.
To get a better understanding on how Streams work and how to combine them with other language features, check out our guide to Java Streams:
Explore Spring Boot 3 and Spring 6 in-depth through building a full REST API with the framework:
Yes, Spring Security can be complex, from the more advanced functionality within the Core to the deep OAuth support in the framework.
I built the security material as two full courses - Core and OAuth, to get practical with these more complex scenarios. We explore when and how to use each feature and code through it on the backing project.
You can explore the course here:
Spring Data JPA is a great way to handle the complexity of JPA with the powerful simplicity of Spring Boot.
Get started with Spring Data JPA through the guided reference course:
Refactor Java code safely — and automatically — with OpenRewrite.
Refactoring big codebases by hand is slow, risky, and easy to put off. That’s where OpenRewrite comes in. The open-source framework for large-scale, automated code transformations helps teams modernize safely and consistently.
Each month, the creators and maintainers of OpenRewrite at Moderne run live, hands-on training sessions — one for newcomers and one for experienced users. You’ll see how recipes work, how to apply them across projects, and how to modernize code with confidence.
Join the next session, bring your questions, and learn how to automate the kind of work that usually eats your sprint time.
Yes, we're now running our only Summer Sale. All Courses are 30% off until 20th July, 2026:
Yes, we're now running our only Summer Sale. All Courses are 30% off until 20th July, 2026:
1. Overview
In this tutorial, we’ll explore how to monitor a Java application using New Relic, a powerful observability platform that provides real-time insights into application performance. It can monitor response times, throughput, error rates, and more.
To explore New Relic’s capabilities, we’ll build and monitor a simple Spring Boot application.
2. Project Setup
Let’s start by setting up a Spring Boot application and add a few REST endpoints.
2.1. REST Controller
We’ll create a REST controller and expose two endpoints:
@RestController
public class HelloController {

    @GetMapping("/hello")
    public String hello() {
        return "Hello, New Relic!";
    }

    @GetMapping("/error")
    public String error() {
        throw new RuntimeException("An error occurred");
    }
}
This controller exposes an endpoint /hello that returns a simple message and an endpoint /error that throws an exception. We’ll use these endpoints to demonstrate how New Relic can monitor the application’s performance and errors.
3. Installing New Relic
To monitor our Java application with New Relic, we must sign up for an account and configure the New Relic Java agent. It is free to sign up, and we can later choose a plan based on our requirements.
After signing up, we can start setting up our agent locally.
3.1. Maven Dependencies
First, we should include the newrelic-java Maven dependency as a zip file:
<dependency>
    <groupId>com.newrelic.agent.java</groupId>
    <artifactId>newrelic-java</artifactId>
    <version>8.18.0</version>
    <scope>provided</scope>
    <type>zip</type>
</dependency>
The zip contains the agent JAR and the files needed to run it. The provided scope ensures that the New Relic agent is available at runtime but not included in the JAR file of our application.
3.2. Add unpack-dependencies Goal to the Maven Dependency Plugin
We must also configure the Maven dependency plugin to unpack the ZIP file when the application is packaged.
For this, we’ll add the unpack-dependencies goal to the Maven Dependency Plugin to unzip the New Relic Java agent:
<plugin>
    <groupId>org.apache.maven.plugins</groupId>
    <artifactId>maven-dependency-plugin</artifactId>
    <version>3.1.1</version>
    <executions>
        <execution>
            <id>unpack-newrelic</id>
            <phase>package</phase>
            <goals>
                <goal>unpack-dependencies</goal>
            </goals>
            <configuration>
                <includeGroupIds>com.newrelic.agent.java</includeGroupIds>
                <includeArtifactIds>newrelic-java</includeArtifactIds>
                <!-- you can optionally exclude files -->
                <excludes>**/newrelic.yml</excludes>
                <overWriteReleases>false</overWriteReleases>
                <overWriteSnapshots>false</overWriteSnapshots>
                <overWriteIfNewer>true</overWriteIfNewer>
                <outputDirectory>${project.build.directory}</outputDirectory>
            </configuration>
        </execution>
    </executions>
</plugin>
When we build the project, Maven downloads the New Relic Java agent. And when we package the application, the agent is unzipped into the /target directory.
This will make the agent available on our classpath at runtime.
3.3. Configuring the Agent
To customize the agent to use our account and configurations, we can download a template of the newrelic.yml file and edit it. The two most important entries are the app_name and license_key. The app_name is the name that will be displayed on the New Relic dashboard against the metrics of this application. The license_key can be created/obtained from New Relic API Keys.
Let’s look at the minimal newrelic.yml config file required:
common: &default_settings
  license_key: 'YOUR_LICENSE_KEY'
  app_name: 'NewRelicApplication'
New Relic also provides a guided installation wizard for the above steps.
4. Running the Application
Now that the dependency is available, we’ll add the agent to the classpath to monitor the application with New Relic. We’ll also make a few requests to our APIs and check the dashboard.
4.1. Starting the Agent
We can use the -javaagent JVM option when running the application.
Additionally, if the JAR and the configuration file are not in the same directory, we must provide the path to the configuration file using the -Dnewrelic.config.file option.
Let’s launch our application and instrument it with New Relic:
java -javaagent:path/to/newrelic.jar -Dnewrelic.config.file=path/to/newrelic.yml -jar target/my-app.jar4.2. Making Requests
Specifically, we’ll call the /hello and /error endpoints using any browser or client to generate monitoring data.
For example, we can send the requests using the curl command:
curl http://localhost:8080/hello
curl http://localhost:8080/error
We can hit these endpoints multiple times to generate some traffic. The agent captures these requests, including how the server performed them and when they were received.
5. Monitoring Dashboard
Once the application is running and has received traffic, we can navigate to the New Relic dashboard to view the captured metrics and insights. The dashboard is available under our profile from the list of applications connected to our license key.
Next, let’s look at a few examples of metrics that New Relic provides.
5.1. Application Overview
We can select the APM & Services > Summary tab for an overview of the application’s performance. This includes metrics like response time, throughput, error rate, and more:
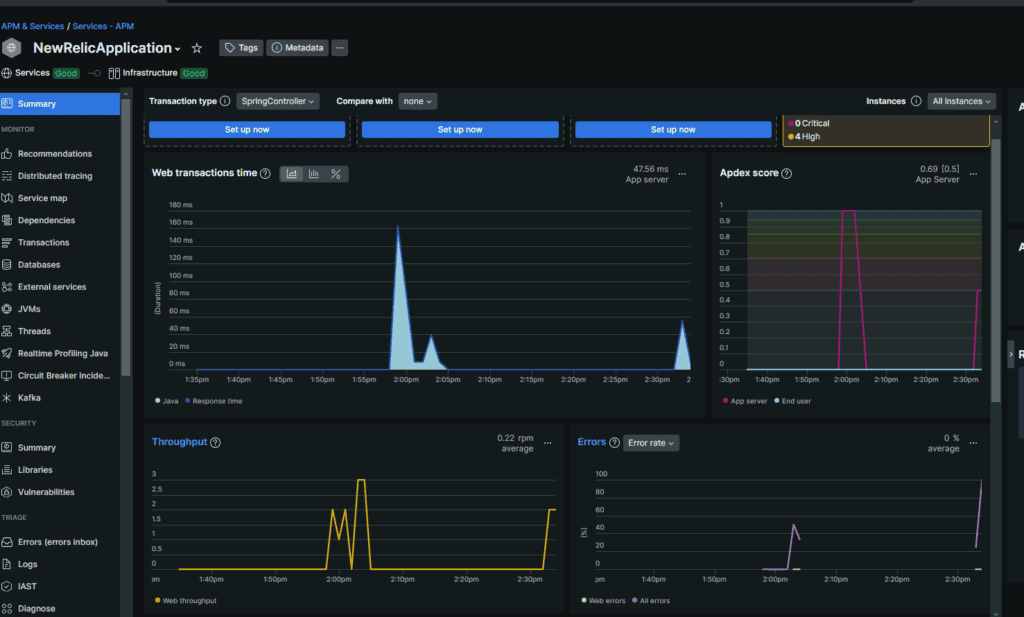
Here, we can see “Web transaction time”, “Throughput”, and “Error Rate”.
5.2. Diving Into API Performance
We can also dive into specific requests to view detailed metrics for each endpoint.
If we scroll down, we can see the transactions listed:
Clicking on any of them will also provide more detailed metrics:
Finally, this helps identify bottlenecks in the application and optimize performance on a per-route basis.
5.3. JVM Metrics
Another important aspect is monitoring JVM metrics. Additionally, we can view the JVM metrics like CPU Utilization, memory usage, heap memory, non-heap memory, and garbage collection times under the JVM tab:

We can also view the JVM thread usage:
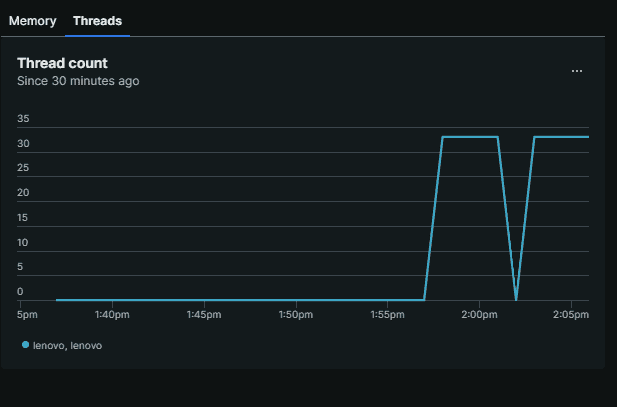
These metrics specifically help us understand how the application utilizes system resources and identify any potential issues.
6. Conclusion
In this tutorial, we explored how to get started with monitoring a Java application using New Relic. We set up a simple Spring Boot application, configured the New Relic Java agent, and also viewed the metrics on the New Relic dashboard.
New Relic provides a powerful platform for monitoring and optimizing the performance of Java applications. Finally, by leveraging these insights, we can identify bottlenecks, optimize performance, and ensure the reliability of our applications.


