

Mocking is an essential part of unit testing, and the Mockito library makes it easy to write clean and intuitive unit tests for your Java code.
Get started with mocking and improve your application tests using our Mockito guide:
Handling concurrency in an application can be a tricky process with many potential pitfalls. A solid grasp of the fundamentals will go a long way to help minimize these issues.
Get started with understanding multi-threaded applications with our Java Concurrency guide:
Spring 5 added support for reactive programming with the Spring WebFlux module, which has been improved upon ever since. Get started with the Reactor project basics and reactive programming in Spring Boot:
Since its introduction in Java 8, the Stream API has become a staple of Java development. The basic operations like iterating, filtering, mapping sequences of elements are deceptively simple to use.
But these can also be overused and fall into some common pitfalls.
To get a better understanding on how Streams work and how to combine them with other language features, check out our guide to Java Streams:
Explore Spring Boot 3 and Spring 6 in-depth through building a full REST API with the framework:
Yes, Spring Security can be complex, from the more advanced functionality within the Core to the deep OAuth support in the framework.
I built the security material as two full courses - Core and OAuth, to get practical with these more complex scenarios. We explore when and how to use each feature and code through it on the backing project.
You can explore the course here:
Spring Data JPA is a great way to handle the complexity of JPA with the powerful simplicity of Spring Boot.
Get started with Spring Data JPA through the guided reference course:
Refactor Java code safely — and automatically — with OpenRewrite.
Refactoring big codebases by hand is slow, risky, and easy to put off. That’s where OpenRewrite comes in. The open-source framework for large-scale, automated code transformations helps teams modernize safely and consistently.
Each month, the creators and maintainers of OpenRewrite at Moderne run live, hands-on training sessions — one for newcomers and one for experienced users. You’ll see how recipes work, how to apply them across projects, and how to modernize code with confidence.
Join the next session, bring your questions, and learn how to automate the kind of work that usually eats your sprint time.
Yes, we're now running our only Summer Sale. All Courses are 30% off until 20th July, 2026:
Yes, we're now running our only Summer Sale. All Courses are 30% off until 20th July, 2026:
1. Overview
In this article, we’ll see how sometimes false sharing can turn multithreading against us.
First, we’re going to start with a little bit on the theory of caching and spatial locality. Then we’ll rewrite the LongAdder concurrent utility and benchmark it against the java.util.concurrent implementation. Throughout the article, we’ll use the benchmark results at different levels to investigate the effect of false sharing.
The Java-related part of the article depends heavily on the memory layout of objects. Since these layout details are not part of the JVM specification and are left to the discretion of the implementor, we’ll only focus on one specific JVM implementation: the HotSpot JVM. We may also use the JVM and HotSpot JVM terms interchangeably throughout the article.
2. Cache Line and Coherency
Processors use different levels of caching — when a processor reads a value from the main memory, it may cache that value to improve performance.
As it turns out, most modern processors not only cache the requested value but also cache a few more nearby values. This optimization is based on the idea of spatial locality and can significantly improve the overall performance of applications. Simply put, processor caches are working in terms of cache lines, instead of single cacheable values.
When multiple processors are operating on the same or nearby memory locations, they may end up sharing the same cache line. In such situations, it’s essential to keep those overlapping caches in different cores consistent with each other. The act of maintaining such consistency is called cache coherency.
There are quite a few protocols to maintain the cache coherency between CPU cores. In this article, we’re going to talk about the MESI protocol.
2.1. The MESI Protocol
In the MESI protocol, each cache line can be in one of these four distinct states: Modified, Exclusive, Shared, or Invalid. The word MESI is the acronym of these states.
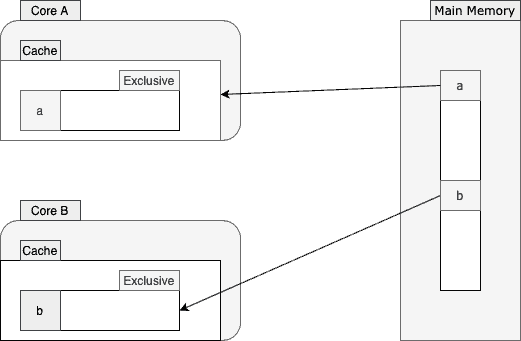
To better understand how this protocol works, let’s walk through an example. Suppose two cores are going to read from nearby memory locations:
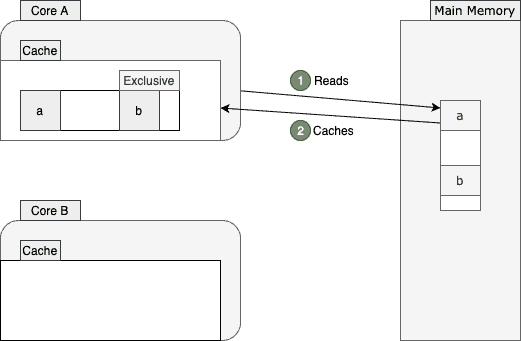
Core A reads the value of a from the main memory. As shown above, this core fetches a few more values from the memory and stores them into a cache line. Then it marks that cache line as exclusive since core A is the only core operating on this cache line. From now on, when possible, this core will avoid the inefficient memory access by reading from the cache line instead.
After a while, core B also decides to read the value of b from the main memory:
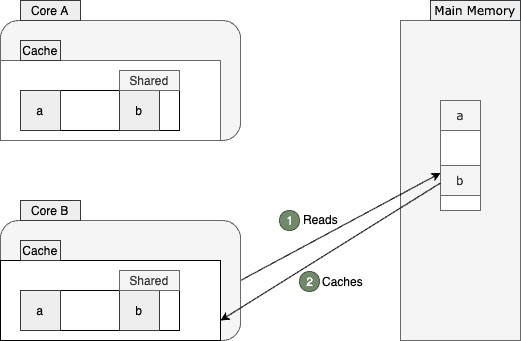
Since a and b are so close to each other and reside in the same cache line, both cores will tag their cache lines as shared.
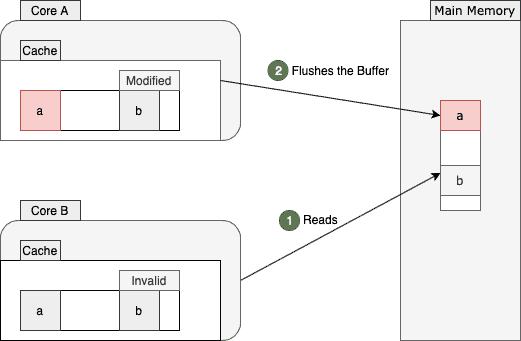
Now, let’s suppose that core A decides to change the value of a:
The core A stores this change only in its store buffer and marks its cache line as modified. Also, it communicates this change to the core B, and this core will, in turn, mark its cache line as invalid.
That’s how different processors make sure that their caches are coherent with each other.
3. False Sharing
Now, let’s see what happens when core B decides to re-read the value of b. As this value didn’t change recently, we might expect a fast read from the cache line. However, the nature of shared multiprocessor architecture invalidates this expectation in reality.
As mentioned earlier, the whole cache line was shared between the two cores. Since the cache line for core B is invalid now, it should read the value b from the main memory again:
As shown above, reading the same b value from the main memory is not the only inefficiency here. This memory access will force the core A to flush its store buffer, as the core B needs to get the latest value. After flushing and fetching the values, both cores will end up with the latest cache line version tagged in the shared state again:
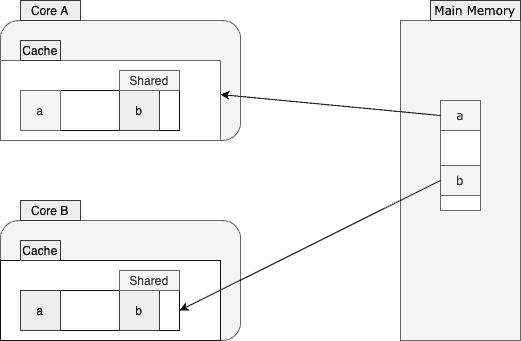
So, this imposes a cache miss to one core and an early buffer flush to another one, even though the two cores weren’t operating on the same memory location. This phenomenon, known as false sharing, can hurt the overall performance, especially when the rate of the cache misses is high. To be more specific, when this rate is high, processors will constantly reach out to the main memory instead of reading from their caches.
4. Example: Dynamic Striping
To demonstrate how false sharing can affect the throughput or latency of applications, we’re going to cheat in this section. Let’s define two empty classes:
abstract class Striped64 extends Number {}
public class LongAdder extends Striped64 implements Serializable {}
Of course, empty classes aren’t that useful, so let’s copy-paste some logic into them.
For our Striped64 class, we can copy everything from the java.util.concurrent.atomic.Striped64 class and paste it into our class. Please make sure to copy the import statements, too. Also, if using Java 8, we should make sure to replace any call to sun.misc.Unsafe.getUnsafe() method to a custom one:
private static Unsafe getUnsafe() {
    try {
        Field field = Unsafe.class.getDeclaredField("theUnsafe");
        field.setAccessible(true);

        return (Unsafe) field.get(null);
    } catch (Exception e) {
        throw new RuntimeException(e);
    }
}
We can’t call the sun.misc.Unsafe.getUnsafe() from our application classloader, so we have to cheat again with this static method. As of Java 9, however, the same logic is implemented using VarHandles, so we won’t need to do anything special there, and just a simple copy-paste would suffice.
For the LongAdder class, let’s copy everything from the java.util.concurrent.atomic.LongAdder class and paste it into ours. Again, we should copy the import statements, too.
Now, let’s benchmark these two classes against each other: our custom LongAdder and java.util.concurrent.atomic.LongAdder.
4.1. Benchmark
To benchmark these classes against each other, let’s write a simple JMH benchmark:
@State(Scope.Benchmark)
public class FalseSharing {

    private java.util.concurrent.atomic.LongAdder builtin = new java.util.concurrent.atomic.LongAdder();
    private LongAdder custom = new LongAdder();

    @Benchmark
    public void builtin() {
        builtin.increment();
    }

    @Benchmark
    public void custom() {
        custom.increment();
    }
}
If we run this benchmark with two forks and 16 threads in throughput benchmark mode (the equivalent of passing “–-bm thrpt -f 2 -t 16″ arguments), then JMH will print these stats:
Benchmark              Mode  Cnt          Score          Error  Units
FalseSharing.builtin  thrpt   40  523964013.730 ± 10617539.010  ops/s
FalseSharing.custom   thrpt   40  112940117.197 ±  9921707.098  ops/s
The result doesn’t make sense at all. The JDK built-in implementation dwarfs our copy-pasted solution by almost 360% more throughput.
Let’s see the difference between latencies:
Benchmark             Mode  Cnt   Score   Error  Units
FalseSharing.builtin  avgt   40  28.396 ± 0.357  ns/op
FalseSharing.custom   avgt   40  51.595 ± 0.663  ns/op
As shown above, the built-in solution also has better latency characteristics.
To better understand what’s so different about these seemingly identical implementations, let’s inspect some low-level performance monitoring counters.
5. Perf Events
To instrument low-level CPU events, such as cycles, stall cycles, instructions per cycle, cache loads/misses, or memory loads/stores, we can program special hardware registers on the processors.
As it turns out, tools like perf or eBPF are already using this approach to expose useful metrics. As of Linux 2.6.31, perf is the standard Linux profiler capable of exposing useful Performance Monitoring Counters or PMCs.
So, we can use perf events to see what’s going on at the CPU level when running each of these two benchmarks. For instance, if we run:
perf stat -d java -jar benchmarks.jar -f 2 -t 16 --bm thrpt customPerf will make JMH run the benchmarks against the copy-pasted solution and print the stats:
161657.133662      task-clock (msec)         #    3.951 CPUs utilized
         9321      context-switches          #    0.058 K/sec
          185      cpu-migrations            #    0.001 K/sec
        20514      page-faults               #    0.127 K/sec
            0      cycles                    #    0.000 GHz
 219476182640      instructions
  44787498110      branches                  #  277.052 M/sec
     37831175      branch-misses             #    0.08% of all branches
  91534635176      L1-dcache-loads           #  566.227 M/sec
   1036004767      L1-dcache-load-misses     #    1.13% of all L1-dcache hits
The L1-dcache-load-misses field represents the number of cache misses for the L1 data cache. As shown above, this solution has encountered around one billion cache misses (1,036,004,767 to be exact). If we gather the same stats for the built-in approach:
161742.243922      task-clock (msec)         #    3.955 CPUs utilized
         9041      context-switches          #    0.056 K/sec
          220      cpu-migrations            #    0.001 K/sec
        21678      page-faults               #    0.134 K/sec
            0      cycles                    #    0.000 GHz
 692586696913      instructions
 138097405127      branches                  #  853.812 M/sec
     39010267      branch-misses             #    0.03% of all branches
 291832840178      L1-dcache-loads           # 1804.308 M/sec
    120239626      L1-dcache-load-misses     #    0.04% of all L1-dcache hits
We would see that it encounters a lot fewer cache misses (120,239,626 ~ 120 million) compared to the custom approach. Therefore, the high number of cache misses might be the culprit for such a difference in performance.
Let’s dig even deeper into the internal representation of LongAdder to find the actual culprit.
6. Dynamic Striping Revisited
The java.util.concurrent.atomic.LongAdder is an atomic counter implementation with high throughput. Instead of just using one counter, it’s using an array of them to distribute the memory contention between them. This way, it will outperform the simple atomics such as AtomicLong in highly contended applications.
The Striped64 class is responsible for this distribution of memory contention, and this is how this class implements those array of counters:
@jdk.internal.vm.annotation.Contended
static final class Cell {
    volatile long value;
    // omitted
}
transient volatile Cell[] cells;
Each Cell encapsulates the details for each counter. This implementation makes it possible for different threads to update different memory locations. Since we’re using an array (that is, stripes) of states, this idea is called dynamic striping. Interestingly, Striped64 is named after this idea and the fact that it works on 64-bit data types.
Anyway, the JVM may allocate those counters near each other in the heap. That is, a few those counters will be in the same cache line. Therefore, updating one counter may invalidate the cache for nearby counters.
The key takeaway here is, the naive implementation of dynamic striping will suffer from false sharing. However, by adding enough padding around each counter, we can make sure that each of them resides on its cache line, thus preventing the false sharing:
As it turns out, the @jdk.internal.vm.annotation.Contended annotation is responsible for adding this padding.
The only question is, why didn’t this annotation work in the copy-pasted implementation?
7. Meet @Contended
Java 8 introduced the sun.misc.Contended annotation (Java 9 repackaged it under the jdk.internal.vm.annotation package) to prevent false sharing.
Basically, when we annotate a field with this annotation, the HotSpot JVM will add some paddings around the annotated field. This way, it can make sure that the field resides on its own cache line. Moreover, if we annotate a whole class with this annotation, the HotSopt JVM will add the same padding before all the fields.
The @Contended annotation is meant to be used internally by the JDK itself. So by default, it doesn’t affect the memory layout of non-internal objects. That’s the reason why our copy-pasted adder doesn’t perform as well as the built-in one.
To remove this internal-only restriction, we can use the -XX:-RestrictContended tuning flag when rerunning the benchmark:
Benchmark              Mode  Cnt          Score          Error  Units
FalseSharing.builtin  thrpt   40  541148225.959 ± 18336783.899  ops/s
FalseSharing.custom   thrpt   40  546022431.969 ± 16406252.364  ops/s
As shown above, now the benchmark results are much closer, and the difference probably is just a bit of noise.
7.1. Padding Size
By default, the @Contended annotation adds 128 bytes of padding. That’s mainly because the cache line size in many modern processors is around 64/128 bytes.
This value, however, is configurable through the -XX:ContendedPaddingWidth tuning flag. As of this writing, this flag only accepts values between 0 and 8192.
7.2. Disabling the @Contended
It’s also possible to disable the @Contended effect via the -XX:-EnableContended tuning. This may prove to be useful when the memory is at a premium and we can afford to lose a bit (and sometimes a lot) of performance.
7.3. Use Cases
After its first release, the @Contended annotation has been used quite extensively to prevent false sharing in JDK’s internal data structures. Here are a few notable examples of such implementations:
- The Striped64 class to implement counters and accumulators with high throughput
- The Thread class to facilitate the implementation of efficient random number generators
- The ForkJoinPool work-stealing queue
- The ConcurrentHashMap implementation
- The dual data structure used in the Exchanger class
8. Conclusion
In this article, we saw how sometimes false sharing might cause counterproductive effects on the performance of multithreaded applications.
To make matters more concrete, we did benchmark the LongAdder implementation in Java against its copy and used its results as a starting point for our performance investigations.
Also, we used the perf tool to gather some stats about the performance metrics of a running application on Linux. To see more examples of perf, it’s highly recommended to read Branden Greg‘s blog. Moreover, eBPF, available as of Linux Kernel version 4.4, can also be useful in many tracing and profiling scenarios.


