

Mocking is an essential part of unit testing, and the Mockito library makes it easy to write clean and intuitive unit tests for your Java code.
Get started with mocking and improve your application tests using our Mockito guide:
Handling concurrency in an application can be a tricky process with many potential pitfalls. A solid grasp of the fundamentals will go a long way to help minimize these issues.
Get started with understanding multi-threaded applications with our Java Concurrency guide:
Spring 5 added support for reactive programming with the Spring WebFlux module, which has been improved upon ever since. Get started with the Reactor project basics and reactive programming in Spring Boot:
Since its introduction in Java 8, the Stream API has become a staple of Java development. The basic operations like iterating, filtering, mapping sequences of elements are deceptively simple to use.
But these can also be overused and fall into some common pitfalls.
To get a better understanding on how Streams work and how to combine them with other language features, check out our guide to Java Streams:
Explore Spring Boot 3 and Spring 6 in-depth through building a full REST API with the framework:
Yes, Spring Security can be complex, from the more advanced functionality within the Core to the deep OAuth support in the framework.
I built the security material as two full courses - Core and OAuth, to get practical with these more complex scenarios. We explore when and how to use each feature and code through it on the backing project.
You can explore the course here:
Spring Data JPA is a great way to handle the complexity of JPA with the powerful simplicity of Spring Boot.
Get started with Spring Data JPA through the guided reference course:
Refactor Java code safely — and automatically — with OpenRewrite.
Refactoring big codebases by hand is slow, risky, and easy to put off. That’s where OpenRewrite comes in. The open-source framework for large-scale, automated code transformations helps teams modernize safely and consistently.
Each month, the creators and maintainers of OpenRewrite at Moderne run live, hands-on training sessions — one for newcomers and one for experienced users. You’ll see how recipes work, how to apply them across projects, and how to modernize code with confidence.
Join the next session, bring your questions, and learn how to automate the kind of work that usually eats your sprint time.
1. Introduction
Remote debugging gives developers the ability to diagnose unique bugs on a server or another process. It provides the means to track down those annoying runtime bugs and identify performance bottlenecks and resource sinks.
In this tutorial, we’ll take a look at remote debugging using JetBrains IntelliJ IDEA. Let’s prepare our sample application first by altering the JVM.
2. Configure the JVM
We’ll use a Spring scheduler sample application to easily connect and add breakpoints to a regularly scheduled task.
Furthermore, IntelliJ IDEA provides our JVM parameters as part of the configuration:
-agentlib:jdwp=transport=dt_socket,server=y,suspend=n,address=*:50052.1. JVM Parameters
Besides the Java Debug Wire Protocol (JDWP) configuration – jdwp=transport=dt_socket – we see the server, suspend, and address parameters.
The server parameter configures the JVM as the target for our debugger. The suspend parameter tells the JVM to wait for a debugger client to connect before startup. Finally, the address parameter uses a wildcard host and a declared port.
So, let’s build the scheduler application:
mvn clean packageAnd now let’s start up the application, including the -agentlib:jdwp parameter:
java -jar -agentlib:jdwp=transport=dt_socket,server=y,suspend=n,address=*:5005 \
  target/gs-scheduling-tasks-0.1.0.jar
Open up any terminal and run the command. With our application started up, let’s now switch over to IntelliJ.
3. Run Configuration in IntelliJ IDEA
Next, in IntelliJ, we create a new Run Configuration for remote debugging:
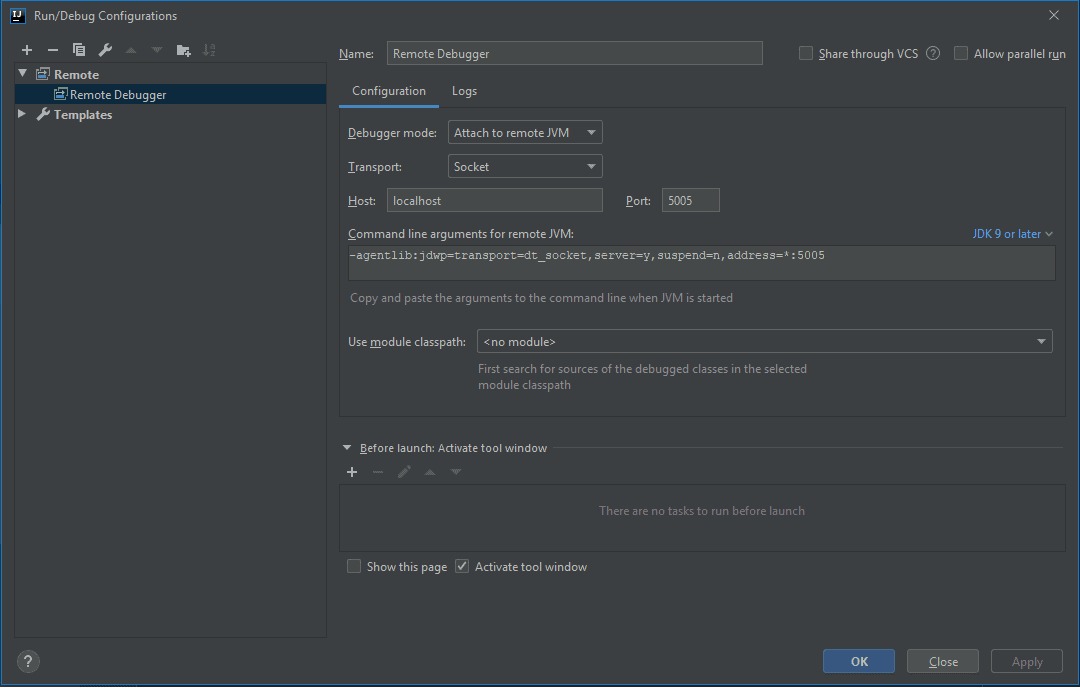
Now that our application is running, let’s start the remote debugging session by clicking the Debug button.
4. Remote Debugging
Next, we open the ScheduleTask file and place a breakpoint at line 36 shown here:
public void reportCurrentTime() {
  log.info("The time is now {}", dateFormat.format(new Date()));
}
Since the task executes every five seconds, it will stop soon after it’s added. As a result, we can now step through the entire application.
For application startup issues, we change the suspend flag to n and place a breakpoint in the main method of Application.
4.1. Limitations
Sometimes logging and output confuse us when remote debugging. The logs will not be sent to the IDE console, so an external log file can be used and mapped into the IDE for more robust debugging ability.
Also remember that while remote debugging is a very powerful tool, a production environment is not a suitable target for debugging.
5. Conclusion
As we covered in this article, remote debugging with IntelliJ is easy to set up and use in a few short steps.
We looked at how to configure our application JVM for debugging as well as some limitations of this important tool in our developer toolbox.


