

1. Introduction
Spring Boot makes it easy to create powerful applications by including just a few dependencies and minimal configuration. In only a few lines, we can set up HTTP endpoints, connect to a database, and process events. It feels like magic — until something goes wrong.
When issues appear, debugging becomes essential. However, understanding what’s happening behind the scenes in a Spring Boot application can be tricky. Configuration values may come from multiple sources, beans might be loaded conditionally, and transaction problems can be hard to pinpoint.
While figuring out an issue, how often do we ask ourselves questions like these:
- What property value is actually used?
- Which bean was injected?
- Is the current transaction active?
- What database is the app connected to?
In this tutorial, we’ll explore how the Spring Debugger plugin for IntelliJ IDEA adds Spring-specific insights to the standard debugger and simplifies application troubleshooting.
2. Getting Started With Spring Debugger
The Spring Debugger requires no special configuration — just install the plugin and run the application in the Debug mode.
It works with the following run configuration types:
- Native IntelliJ IDEA Spring Boot
- Maven spring-boot:run command
- Gradle bootRun task
- Remote attach is still not supported (as of August, 2025)
The plugin integrates with the IDE’s built-in debugger API and works without needing to use Spring Boot Actuator or other extra libraries or agents.
Once we install it, we can immediately start using all its features to explore what’s happening inside our application at runtime — starting with beans.
3. See Which Beans Are Loaded at Runtime
One of the first questions when we start debugging a Spring app is: which beans are actually loaded?
Spring Debugger adds bean-specific icons (distinct by bean type) to the Project view:
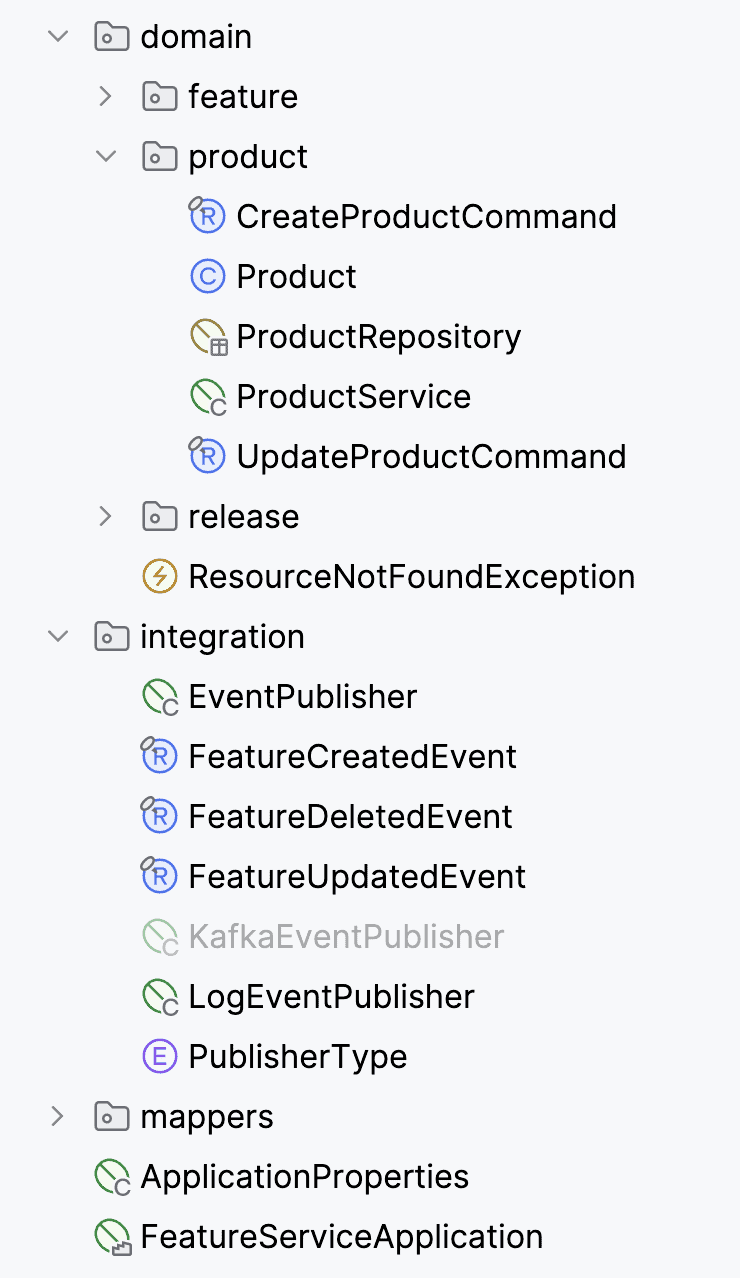
As the example shows, we have:
- Green for loaded beans
- Gray for scanned but unloaded beans
- Orange for mocked beans
This visual feedback is especially helpful in tests or when multiple implementations are available. We can also evaluate any Spring bean from the current application context. In the Evaluate Expression window, autocompletion helps us call methods directly on beans — no code changes or restarts required.
Once we know which beans are loaded, the next challenge is often to figure out why the application is behaving differently from what we expect — and that usually starts with configuration.
4. Find the Real Value of Any Property
Properties don’t always behave as expected — their values may depend on active profiles and their application order, or come from external sources such as environment variables or configuration services.
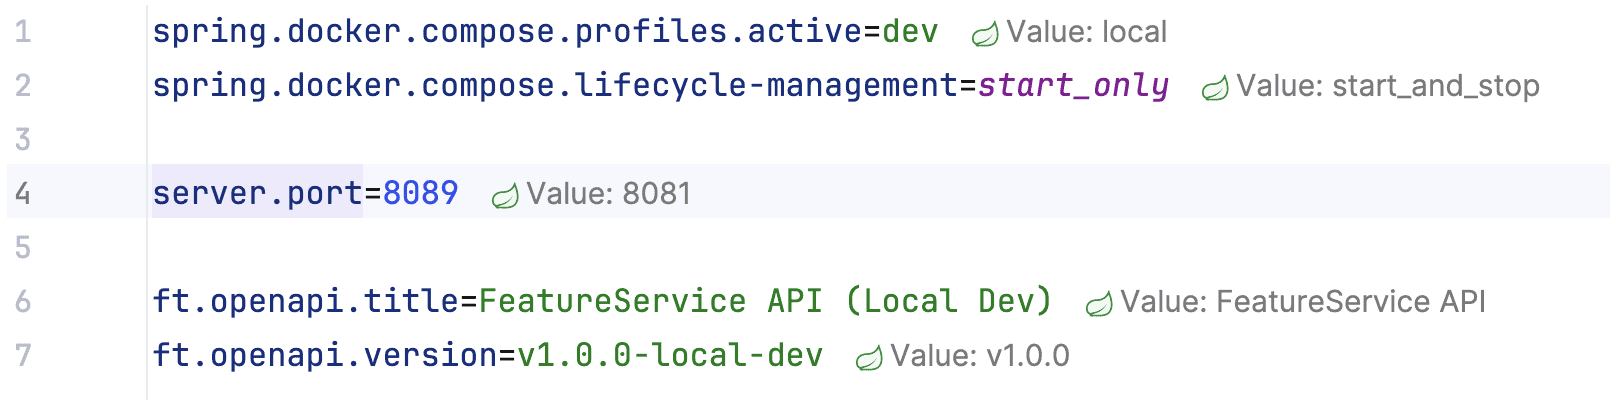
Spring Debugger shows the effective property value inline in the configuration file. Clicking on it navigates to the source that provided the value, whether it’s a file or Java code:
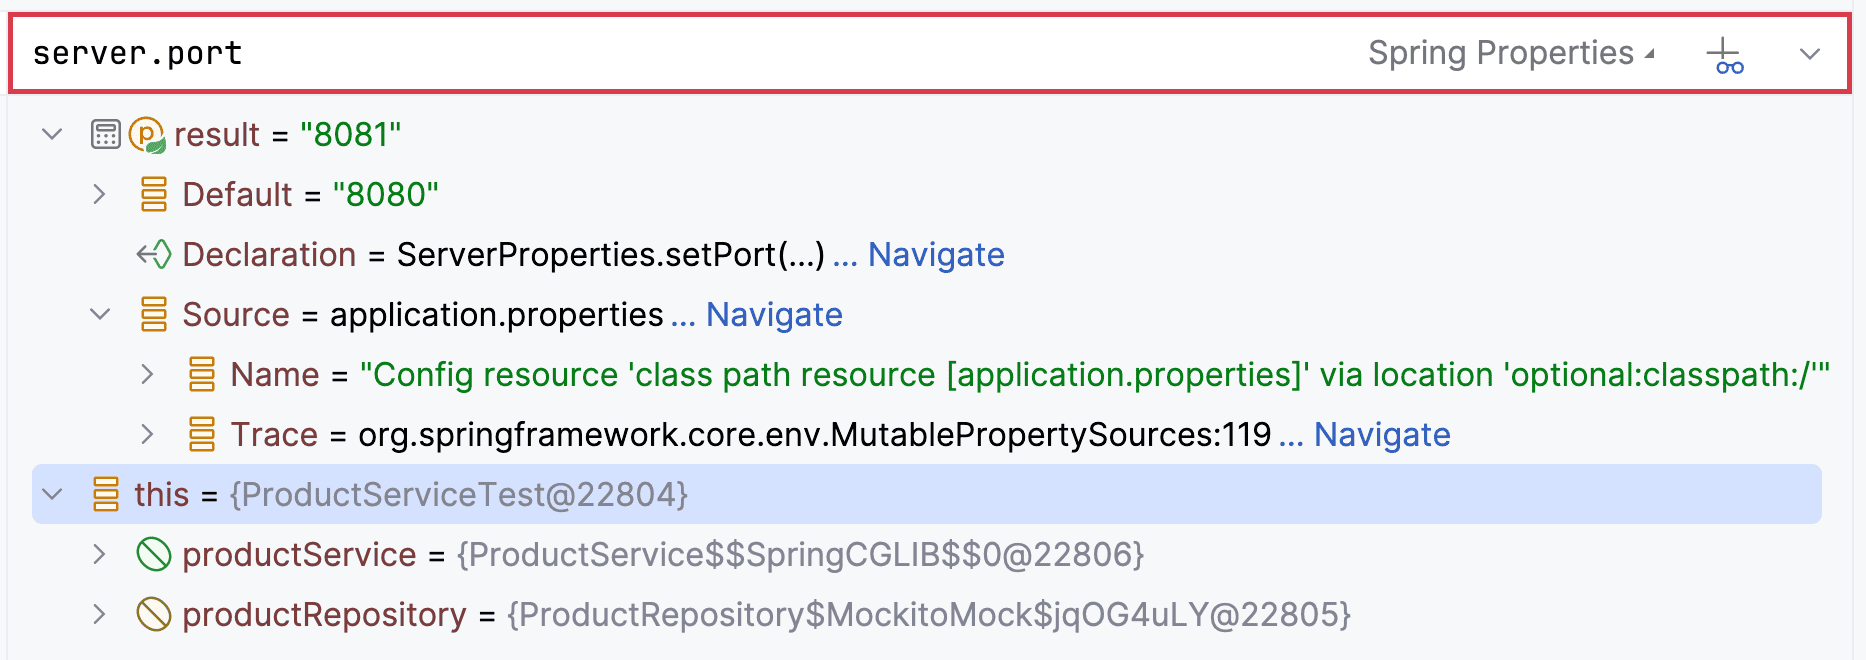
During a debug session, we can evaluate properties in the Evaluate Expression window. In this case, we can see not only the value, but also the source, and the debugger displays a stack trace of how the value was updated.
For environment variables, system settings, or config servers, the IDE gives a clear description of the source even if navigation isn’t possible:
After confirming that the configuration is correct, another common step in troubleshooting is making sure the application is connected to the right database.
5. Check a Database Connection Instantly
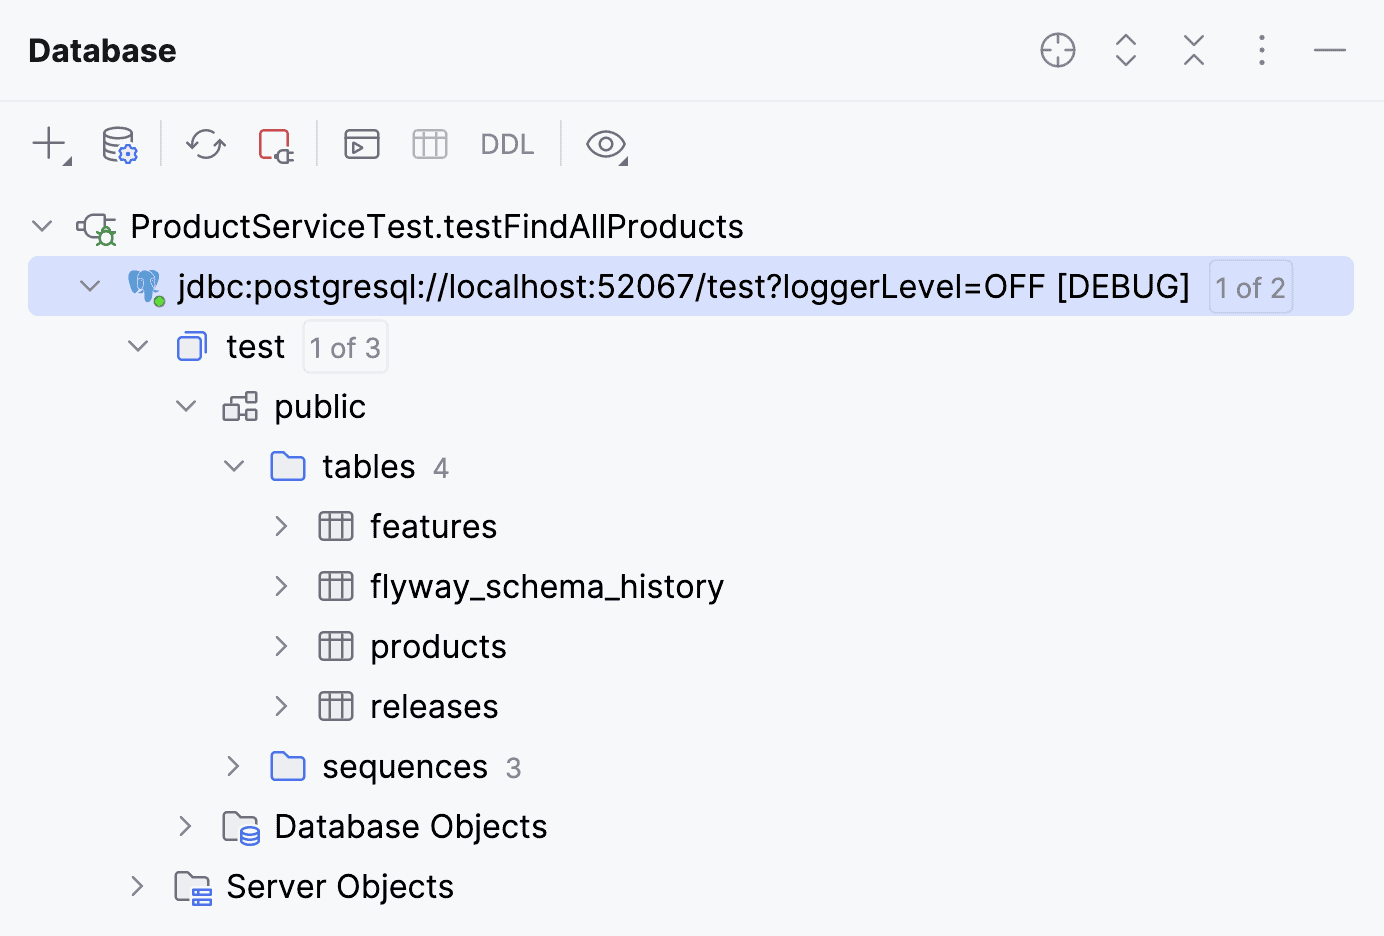
When running integration tests, it’s not always obvious which database the app is connected to — especially with tools like Testcontainers, where ports and credentials can change.
Spring Debugger integrates with the Database tool window to reveal active connections at runtime. We can explore data in the connected container or standalone database without guessing connection strings or scanning logs:
For in-memory databases, Spring Debugger shows the connection, but can’t display the schema or data because these databases exist only inside the application process and are not accessible through the IDE’s JDBC driver without a dedicated endpoint. For this case, we can suspend the application and use beans – a repository, an entity manager or get a connection object directly to execute a SQL or JPQL query
Even when the database connection is correct, issues can still occur due to transaction handling — and those can be even trickier to diagnose.
6. Diagnose Transaction Issues
A common Spring error is LazyInitializationException, which happens when we access a JPA entity outside an active transaction.
During debugging, Spring Debugger shows active transaction and its metadata — whether it’s active, its propagation type, and where it started:
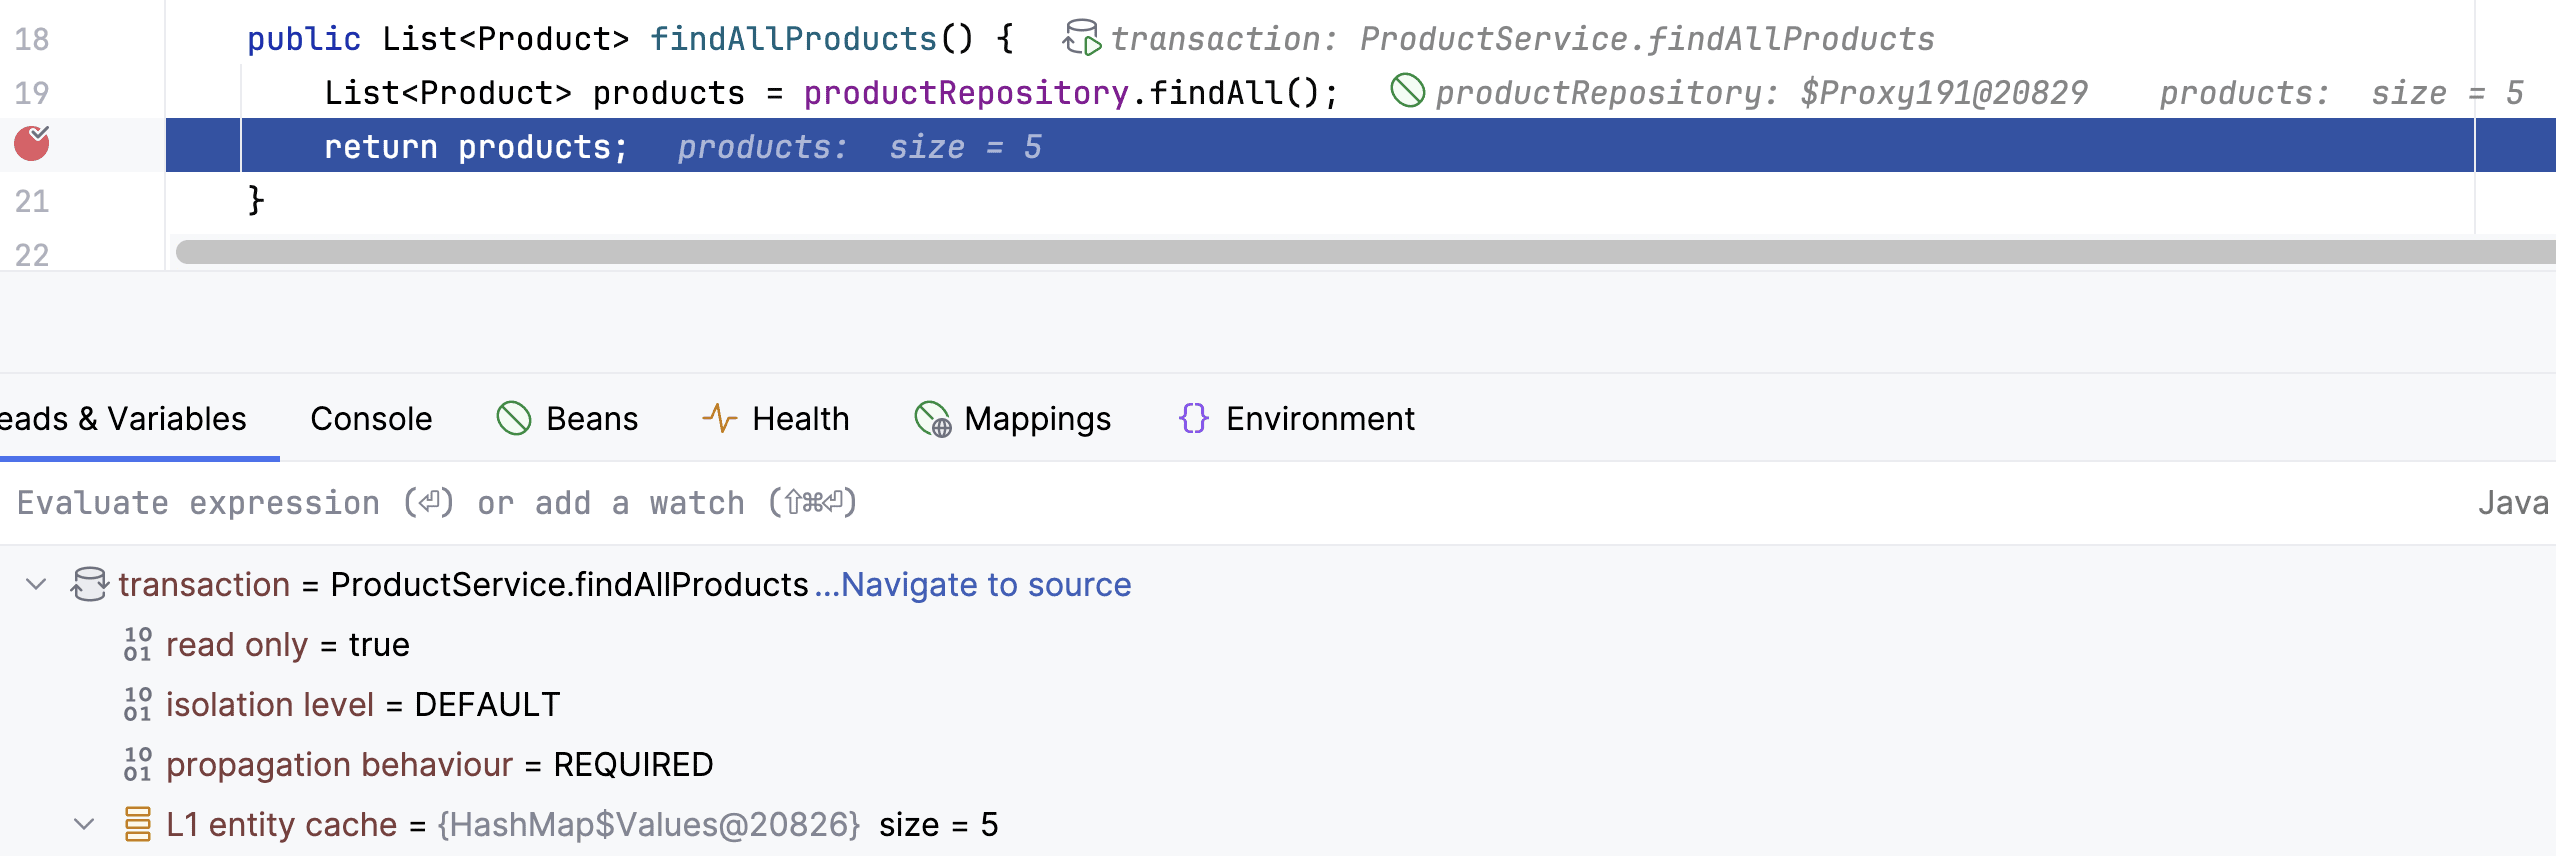
For JPA, it also displays the L1 cache with loaded entities which is updated while we step over the code. With this information, we can clearly see transaction boundaries and spot violations.
If a transaction is active but data still isn’t being persisted or loaded correctly, we can check the entity state.
7. Inspect JPA Entity States
In JPA, entity state matters. Whether an entity is managed, detached, or removed affects cascades, flush operations, and persistence context behavior.
Spring Debugger shows the entity lifecycle state directly in the debugger. At any breakpoint, we can confirm if an entity is attached to the current session:
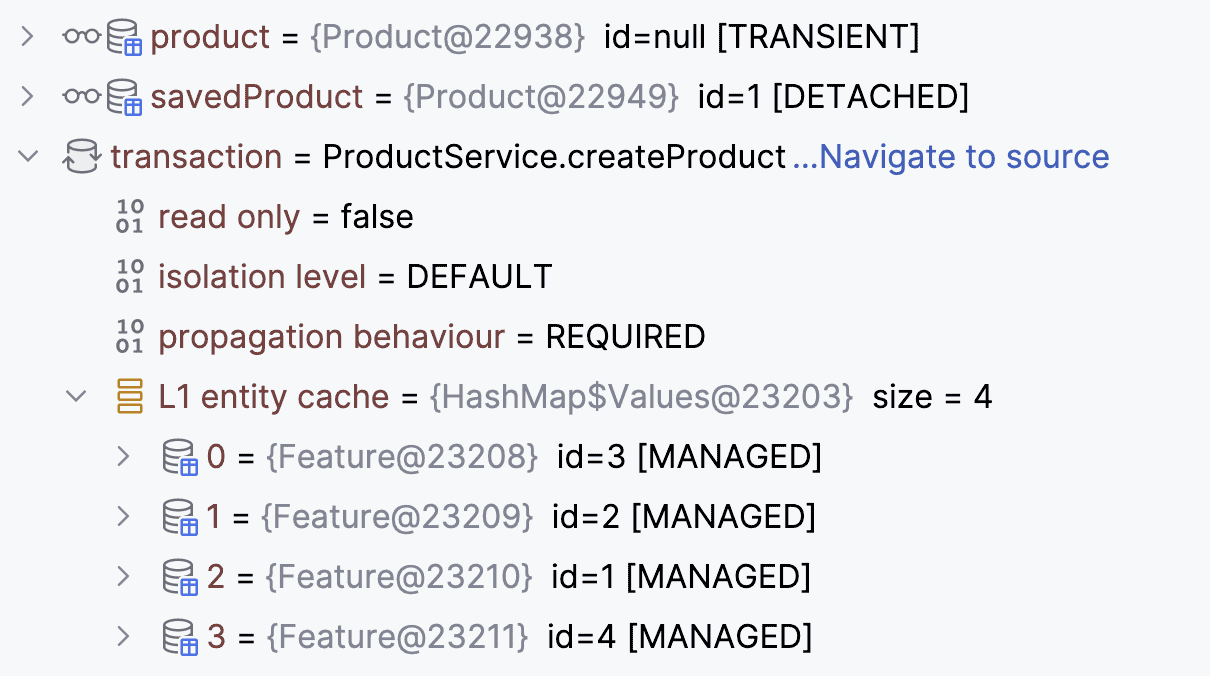
This information helps when debugging persistence-related issues in the service layer when an entity is passed between services.
By combining all these features — bean inspection, property tracing, database connection checks, transaction metadata, and entity state — we get a full picture of what’s happening in the application at runtime.
8. Conclusion
In this article, we learned that debugging Spring Boot often means answering questions about configuration, wiring, transactions, and persistence.
The Spring Debugger plugin brings these answers right into the debugger and editor:
- Instantly see loaded beans and their states
- Invoke any bean from the application context
- Trace the real source of any property value
- View active database connections without guesswork
- Inspect transactions and entity states at a glance
The Spring Debugger plugin is delivered as a separate plugin and not bundled with IntelliJ IDEA (yet). The reason behind this is that plugin developers do not want to depend on the IDEA release cycle and can instead update the plugin as required.
With Spring Debugger, runtime insights become part of our normal debugging flow. We no longer have to switch between logs, configs, and database tools to understand what’s happening. Everything we need — from bean states to transaction details — is right in the IDE, helping us resolve issues faster.