

Mocking is an essential part of unit testing, and the Mockito library makes it easy to write clean and intuitive unit tests for your Java code.
Get started with mocking and improve your application tests using our Mockito guide:
Handling concurrency in an application can be a tricky process with many potential pitfalls. A solid grasp of the fundamentals will go a long way to help minimize these issues.
Get started with understanding multi-threaded applications with our Java Concurrency guide:
Spring 5 added support for reactive programming with the Spring WebFlux module, which has been improved upon ever since. Get started with the Reactor project basics and reactive programming in Spring Boot:
Since its introduction in Java 8, the Stream API has become a staple of Java development. The basic operations like iterating, filtering, mapping sequences of elements are deceptively simple to use.
But these can also be overused and fall into some common pitfalls.
To get a better understanding on how Streams work and how to combine them with other language features, check out our guide to Java Streams:
Explore Spring Boot 3 and Spring 6 in-depth through building a full REST API with the framework:
Yes, Spring Security can be complex, from the more advanced functionality within the Core to the deep OAuth support in the framework.
I built the security material as two full courses - Core and OAuth, to get practical with these more complex scenarios. We explore when and how to use each feature and code through it on the backing project.
You can explore the course here:
Spring Data JPA is a great way to handle the complexity of JPA with the powerful simplicity of Spring Boot.
Get started with Spring Data JPA through the guided reference course:
Refactor Java code safely — and automatically — with OpenRewrite.
Refactoring big codebases by hand is slow, risky, and easy to put off. That’s where OpenRewrite comes in. The open-source framework for large-scale, automated code transformations helps teams modernize safely and consistently.
Each month, the creators and maintainers of OpenRewrite at Moderne run live, hands-on training sessions — one for newcomers and one for experienced users. You’ll see how recipes work, how to apply them across projects, and how to modernize code with confidence.
Join the next session, bring your questions, and learn how to automate the kind of work that usually eats your sprint time.
1. Overview
Since Hibernate handles the interaction with the database for us, we’re able to develop database-related code quickly. But, this can make debugging database-related failures difficult.
Hence, it can be useful to view the interaction of Hibernate with the database. For example, the SQL generated by Hibernate to read data from a table.
In this tutorial, we’ll see the different levels of logging in Hibernate that can be used to achieve this.
2. Logging SQL
At the most basic level, we can log the SQL statements generated by Hibernate without the actual parameter values passed to it.
Hibernate uses the category org.hibernate.SQL to log this information. So, all we’ve to do is set the logging level of this category to DEBUG.
In Log4J, we’ll have to add a logger element in the configuration XML:
<logger name="org.hibernate.SQL">
     <level value="debug"/>
</logger>
Similarly, in Log4J2, we’ll add a Logger element:
<Logger name="org.hibernate.SQL" level="debug"/>And, in Logback, we’ll add a logger element:
<logger name="org.hibernate.SQL" level="DEBUG" />We should now see the generated SQL in the logs:
2019-12-07 23:04:23 | DEBUG | [main] o.h.SQL:127 - insert into Employee
(employeeNumber, name, title, id) values (?, ?, ?, ?)
2019-12-07 23:04:23 | DEBUG | [main] o.h.SQL:127 - select employee0_.id as id1_0_,
employee0_.employeeNumber as employee2_0_, employee0_.name as name3_0_,
employee0_.title as title4_0_ from Employee employee0_
3. Logging Parameter Values
Although normally the generated SQL is enough to identify problems, sometimes we might want to also view the parameters being passed to the SQL statement.
Hibernate logs the input parameters and retrieved results using the org.hibernate.type.descriptor.sql category with a log level of TRACE. Now, let’s add this category to our configuration files.
In Log4J we do:
<logger name="org.hibernate.type.descriptor.sql">
    <level value="trace"/>
</logger>
In Log4J2:
<Logger name="org.hibernate.type.descriptor.sql" level="trace"/>And finally, in Logback:
<logger name="org.hibernate.type.descriptor.sql" level="TRACE" />Consequently, we should see the parameter values passed to the SQL statement as well as the result of the execution:
2019-12-07 23:04:23 | DEBUG | [main] o.h.SQL:127 - insert into Employee (employeeNumber, name, title, id)
values (?, ?, ?, ?)
2019-12-07 23:04:23 | TRACE | [main] o.h.t.d.s.BasicBinder:64 - binding parameter [1]
as [VARCHAR] - [001]
2019-12-07 23:04:23 | TRACE | [main] o.h.t.d.s.BasicBinder:64 - binding parameter [2]
as [VARCHAR] - [John Smith]
2019-12-07 23:04:23 | TRACE | [main] o.h.t.d.s.BasicBinder:52 - binding parameter [3]
as [VARCHAR] - [null]
2019-12-07 23:04:23 | TRACE | [main] o.h.t.d.s.BasicBinder:64 - binding parameter [4]
as [BIGINT] - [1]
2019-12-07 23:04:23 | DEBUG | [main] o.h.SQL:127 - select employee0_.id as id1_0_,
employee0_.employeeNumber as employee2_0_, employee0_.name as name3_0_,
employee0_.title as title4_0_ from Employee employee0_
2019-12-07 23:04:23 | TRACE | [main] o.h.t.d.s.BasicExtractor:60 - extracted value ([id1_0_] :
 [BIGINT]) - [1]
2019-12-07 23:04:23 | TRACE | [main] o.h.t.d.s.BasicExtractor:60 - extracted value ([employee2_0_] :
 [VARCHAR]) - [001]
2019-12-07 23:04:23 | TRACE | [main] o.h.t.d.s.BasicExtractor:60 - extracted value ([name3_0_] :
 [VARCHAR]) - [John Smith]
2019-12-07 23:04:23 | TRACE | [main] o.h.t.d.s.BasicExtractor:50 - extracted value ([title4_0_] :
 [VARCHAR]) - [null]
It’s worth noting that we don’t need to enable the org.hibernate.SQL category to view the above information. We can enable and disable the two categories independently.
But, it makes sense to enable org.hibernate.SQL so that we know which SQL statement the parameter values relate to.
4. Activate Hibernate Statistics
Apart from the SQL and the JDBC parameter values, Hibernate can also log statistics for each SQL statement. This can be useful to identify potential performance issues.
Hibernate uses the category org.hibernate.stat to log this information. But, Hibernate does not always generate these statistics because it can have a bad influence on the performance.
First, we’ve to tell Hibernate to generate these statistics by setting the configuration property hibernate.generate_statistics to true.
For example, we can set this property in our hibernate.cfg.xml file:
<property name="hibernate.generate_statistics">true</property>Along with this property, setting the category org.hibernate.stat to DEBUG will log a statement with the statistics for each query executed. It’ll also log one multi-line log statement at the end of the session that’ll have summarized statistical information:
2019-12-07 23:25:18 | DEBUG | [main] o.h.s.i.StatisticsInitiator:101 - Statistics initialized
[enabled=true]
2019-12-07 23:25:19 | DEBUG | [main] o.h.s.i.StatisticsImpl:729 - HHH000117: HQL:
from com.baeldung.hibernate.logging.Employee, time: 22ms, rows: 1
2019-12-07 23:25:19 | INFO  | [main] o.h.e.i.StatisticalLoggingSessionEventListener:258 -
Session Metrics {
    55600 nanoseconds spent acquiring 1 JDBC connections;
    178600 nanoseconds spent releasing 1 JDBC connections;
    2167200 nanoseconds spent preparing 2 JDBC statements;
    2426800 nanoseconds spent executing 2 JDBC statements;
    0 nanoseconds spent executing 0 JDBC batches;
    0 nanoseconds spent performing 0 L2C puts;
    0 nanoseconds spent performing 0 L2C hits;
    0 nanoseconds spent performing 0 L2C misses;
    47098900 nanoseconds spent executing 1 flushes (flushing a total of 1 entities
    and 0 collections);
    0 nanoseconds spent executing 0 partial-flushes (flushing a total of 0 entities
    and 0 collections)
}
Note the first line in the log that indicates that the statistics are enabled.
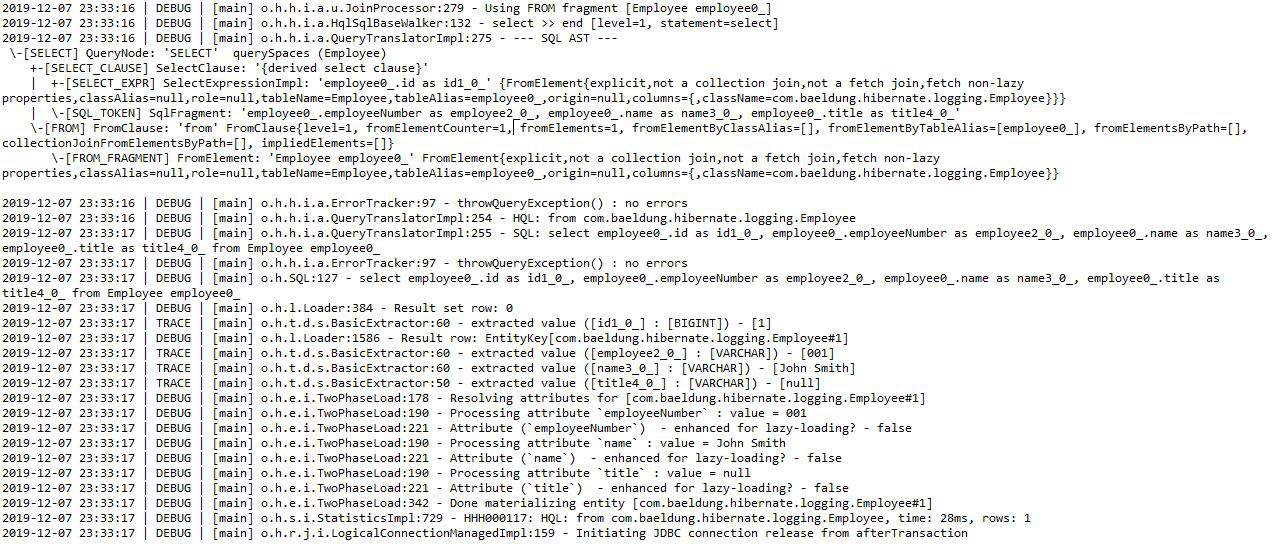
5. Log All Activity
To dig even deeper into Hibernate’s interaction with the database, we’ll have to enable logging for the category org.hibernate. This category contains all messages logged by Hibernate.
But, we must use this category with caution as it might create a lot of log output:
6. Conclusion
In this tutorial, we saw the different levels of logging in Hibernate. The logged information can be very useful during development. But, we’ve to be careful while enabling this in production as it can adversely affect the application performance.


