

Yes, we're now running our only Summer Sale. All Courses are 30% off until 20th July, 2026:
Learn through the super-clean Baeldung Pro experience:
>> Membership and Baeldung Pro.
No ads, dark-mode and 6 months free of IntelliJ Idea Ultimate to start with.
1. Introduction
In this tutorial, we’ll show how to analyze loss vs. epoch graphs.
2. Loss vs. Epoch
Loss vs. epoch graphs are a neat way of visualizing our progress while training a neural network. To make such a graph, we plot the loss against the epochs.
The consecutive points on the line correspond to the values recorded in successive epochs.
These graphs can detect overfitting and underfitting and inform us about early stopping.
3. Overfitting
Overfitting means the network can’t generalize well to unseen data because it starts modeling the noise and randomness in the training dataset.
We can see this in a loss vs. epoch graph. The training and validation losses decrease until an epoch, after which the latter grows while the former keeps dropping:
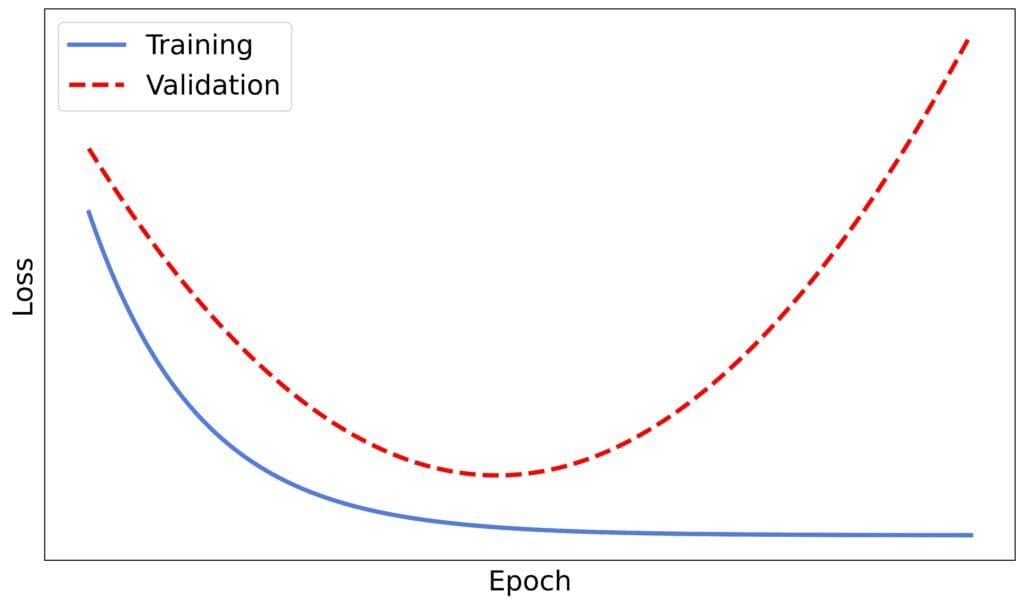
The graph will reveal the point at which overfitting happens. It’s the epoch after which the validation loss curve goes up.
4. Underfitting
Underfitting happens when the patterns in the training dataset are too complex for our model. It can’t capture them, so it has a poor performance on training and validation sets:
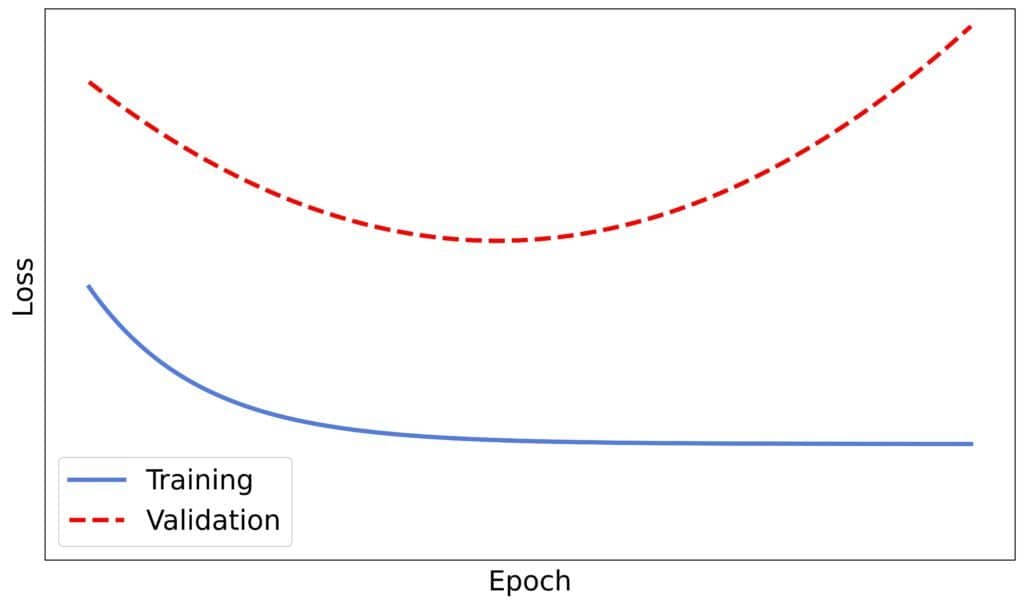
The gap between the two curves is typically large when this happens, which indicates that our model is missing something. For example, we might need to engineer a feature or use a more complex model.
5. Early Stopping
Early stopping is a regularization technique that stops training if it detects overfitting or if no significant progress is made over several consecutive epochs. In the latter case, the training loss curve ends with a plateau:
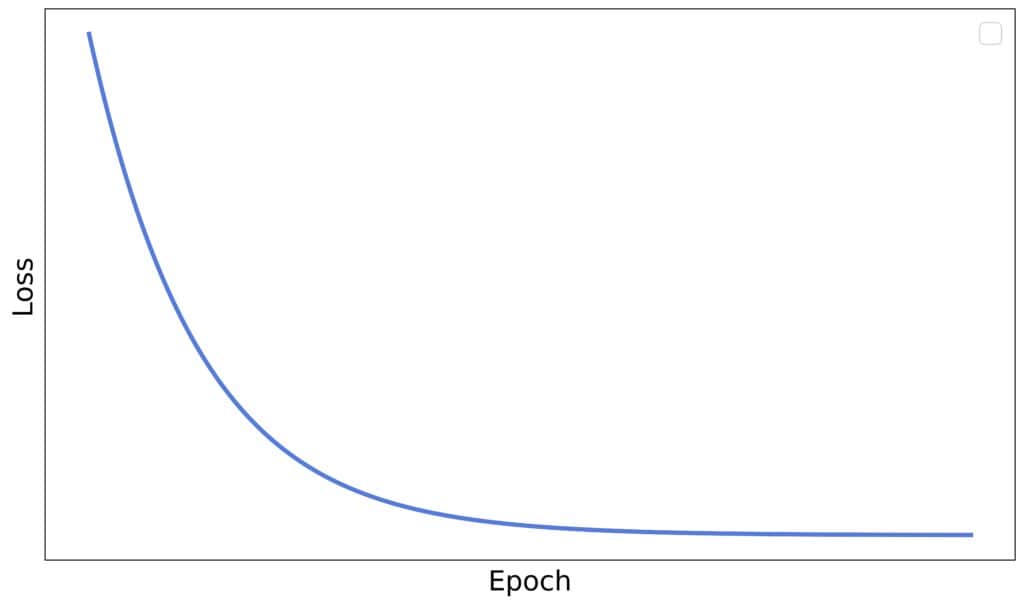
We don’t draw plots to implement early stopping. Instead, we specify the minimum improvement that has to be made over several consecutive epochs for training to continue. Similarly, we can define the maximum difference between the curves and stop training if the gap drops below it. However, visualizing the loss against epochs helps us understand why the training algorithm took an early stop.
6. Conclusion
In this article, we explained loss vs. epoch graphs. We use them in machine learning to detect problems during training.
Our model is overfitting if the validation loss grows while the training loss decreases and underfitting if both losses are large and there’s a significant difference between them.