

Yes, we're now running our only Summer Sale. All Courses are 30% off until 20th July, 2026:
Learn through the super-clean Baeldung Pro experience:
>> Membership and Baeldung Pro.
No ads, dark-mode and 6 months free of IntelliJ Idea Ultimate to start with.
1. Introduction
In this tutorial, we’ll explore ER and EER diagrams. These diagrams serve as visual representations of the logical structure and relationships in database designing and modeling. ER and EER diagrams are commonly used techniques in depicting data entities and their relationships. Both diagrams serve similar purposes.
In addition, EER diagrams offer more features and capabilities when modeling complex data structures and hierarchies effectively.
2. ER Diagrams
Entity-relationship (ER) diagrams are graphical representations used in database design to model the structure and relationships of entities within a system.
ER diagrams, first introduced by Peter Chen in 1979, still serve as a blueprint for designing databases by illustrating the entities, attributes, and relationships between them.
ER diagrams consist of three main components: entities, attributes, and relationships:
2.1. Entities
In the database, system entities represent the fundamental objects or concepts.
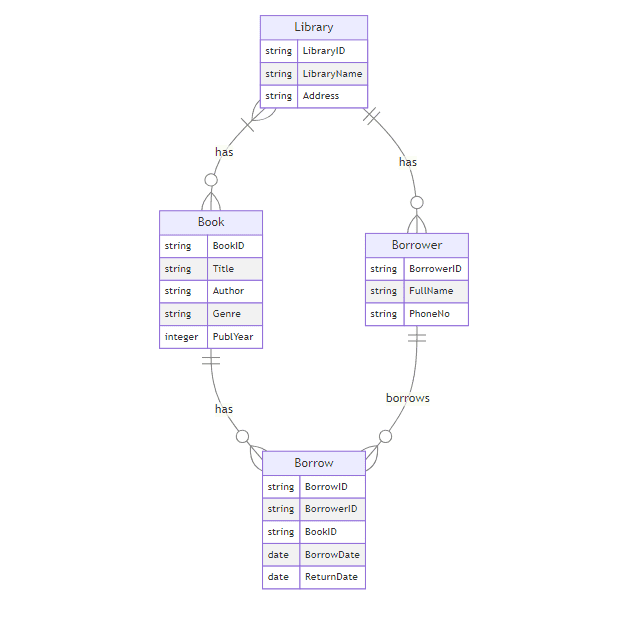
In the above ER diagram example, the entities are Library, Borrower, Book, and Borrow. Each rectangle in the diagram represents an entity.
2.2. Attributes
Attributes are the characteristics or properties that describe the entities. For example, the library entity has LibraryID, LibraryName, and Address attributes. In the diagram, attributes are depicted as ovals connected to their respective entity rectangles.
2.3. Relationships
Relationships represent associations or connections between entities, describing how entities interact or relate to each other. For instance, the relationship has connects the Library to the Borrower, indicating that a Library entity can have one or more Borrower entities associated. Similarly, relationships like has and borrows describe the interactions between Library, Borrower, Book, and Borrow entities.
ER diagrams are an effective tool for capturing a database’s basic structure, such as the entities, their attributes, and the relationships between entities. However, they cannot represent certain advanced concepts and data hierarchies, which can be crucial in modeling complex systems.
3. EER (Enhanced Entity-Relationship Model) Diagrams
In simpler terms, EER (Enhanced Entity-Relationship Model) diagrams build upon ER diagrams. ER diagrams had limitations, so EER diagrams were developed to offer a more comprehensive approach to data modeling. EER (Enhanced Entity-Relationship Model) diagrams incorporate key features allowing more expressive and accurate representations of real-world scenarios.
Let’s consider a university database. We have one base entity named Person, with which we associate all the generic information of persons who belong to the university. Person is a base entity with attributes common to all individuals.
Moreover, two specialized entities, Student and Faculty, inherit attributes from the entity Person. However, each also has some unique attributes of its own.
Other than these two, there is a weak entity CourseEnrollment, which depends on the relationship between students and courses. Entity Course represents courses offered by the university.
The CourseEnrollment is a weak entity because its primary key includes the primary keys of both Student and Course. It can only exist if a relationship exists between the student and the course:
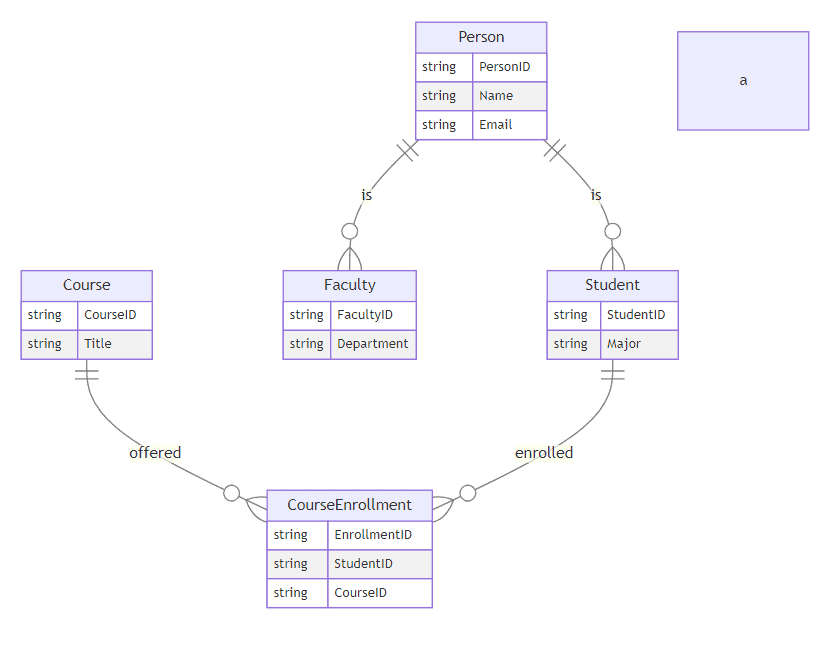
The diagram above depicts the inheritance hierarchy through relationships among Person, Student, and Faculty. Additionally, it illustrates the weak entity CourseEnrollment and its dependency on both Student and Course.
Key features of the EER diagram include Specialization/Generalization, Attribute Inheritance, Relationship Attributes, Cardinality Ratios, and Composite and Multi-valued Attributes.
3.1. Specialization/Generalization Categories
Enhanced Entity-Relationship Model (EER) diagrams introduce the concept of specialization and generalization, enabling the representation of inheritance hierarchies. This means that a parent entity, known as the generalized entity, can have child entities called specialized entities.
Moreover, specialized entities inherit the attributes and relationships from the parent entity, making it easier to model real-world scenarios where certain types of entities share common characteristics.
For instance, in a university system, the Employee entity could be the parent, with specialized entities such as Professor and Administrator as its child entities.
3.2. Categories
EER diagrams also include the concept of categories, which provide a way to divide an entity into subtypes based on a specific attribute or set of attributes. This feature is useful when an entity can be classified into different types or groups.
For instance, in a product database, the Product entity could be categorized into Electronics, Furniture, and Clothing based on the product type.
3.3. Attribute Inheritance
EER diagrams also feature attribute inheritance, enabling specialized entities to inherit attributes from their parent (generalized) entity. This reduces redundancy and promotes data consistency throughout the database design.
For example, in the university system, the Professor entity could inherit attributes such as EmployeeID, Name, and Address from the parent Employee entity.
3.4. Relationship Attributes
EER diagrams can also represent relationships with their attributes, which describe properties specific to the association between entities. This is particularly useful when the relationship between entities has additional information that needs to be captured.
For example, in a hotel reservation system, the Reservation relationship between Customer and Room entities could have attributes like ReservationID, CheckInDate, and CheckOutDate.
3.5. Cardinality Ratios
Cardinality ratios are an important aspect of EER diagrams, as they specify the minimum and maximum number of instances that can be involved in a relationship between entities. This helps to define the constraints and rules governing the relationships within the database.
For example, in a library system, the relationship between Book and Borrow entities might have a cardinality ratio of one-to-many. This indicates that multiple users can borrow a book, but each borrow is associated with only one book.
3.6. Composite and Multi-valued Attributes
Finally, EER diagrams enable the representation of composite and multi-valued attributes. Composite attributes consist of multiple components. Multi-valued attributes can hold multiple values for one attribute.
For instance, within a customer entity, Address could comprise components like StreetAddress, City, State, and ZipCode. Additionally, PhoneNumber could be multi-valued, permitting multiple phone numbers for a customer.
4. EER Advantages Over ER Diagrams
EER diagrams offer several advantages over traditional ER diagrams when it comes to modeling complex systems and hierarchies.
| Advantage | Description |
|---|---|
| Improved Representation of Inheritance | EER diagrams effectively represent inheritance hierarchies, making it easier to model real-world scenarios with specialized subtypes. |
| Better Handling of Complex Relationships | EER diagrams can accurately capture complex relationships between entities using constructs like relationship attributes and cardinality ratios. |
| Enhanced Data Integrity | EER diagrams promote data consistency and reduce redundancy through features like attribute inheritance and categories, leading to improved data integrity. |
| Increased Expressiveness | EER diagrams offer an extended set of features for more expressive and detailed modeling, allowing for better capture of complex system nuances. |
5. Comparison and Use Cases
ER diagrams suit simple database systems well. However, EER diagrams excel in handling complex scenarios.
| Comparison and Use Cases | Description |
|---|---|
| Object-Oriented Systems | EER diagrams are well-suited for modeling object-oriented systems, where inheritance and specialization are common concepts. |
| Hierarchical Organizations | Organizations with complex hierarchies, such as government agencies or large corporations, can benefit from the hierarchical modeling capabilities of EER diagrams. |
| Biological and Scientific Domains | Fields like biology and scientific research often involve intricate relationships and taxonomies, which can be effectively represented using EER diagrams. |
| Enterprise Systems | The enhanced modeling capabilities of EER diagrams better serve large-scale enterprise systems, with their intricate data models and numerous entities. |
6. Conclusion
In this article, we discussed powerful database design and modeling tools, namely ER diagrams and EER diagrams. ER diagrams offer a simple approach to representing entities and relationships. However, EER diagrams provide a more comprehensive set of features. These features enable accurate modeling of complex systems and hierarchies.
Database designers and developers can utilize the strengths of EER diagrams. They can create more expressive and accurate representations of their data models. This leads to improved data integrity, consistency, and overall system quality.