Learn through the super-clean Baeldung Pro experience:
>> Membership and Baeldung Pro.
No ads, dark-mode and 6 months free of IntelliJ Idea Ultimate to start with.
Last updated: May 16, 2023

Learn through the super-clean Baeldung Pro experience:
>> Membership and Baeldung Pro.
No ads, dark-mode and 6 months free of IntelliJ Idea Ultimate to start with.
A data flow diagram (DFD) is a graphical representation of data flow through a system. It’s employed to understand how data is processed, stored, and communicated within a system. Moreover, DFD is used to support the analysis of how the data flows in existing or proposed systems from one page or module to another (using a flowchart). It’s also called a bubble chart.
In this tutorial, we’ll learn the basics of DFD, its purpose, components, levels, and how to create a DFD.
DFDs represent the flow of data in a system or process. They help identify the flow of data and potential bottlenecks in the system. They also help to communicate the structure of a system to non-technical stakeholders and provide a visual representation of the system’s architecture.
A DFD consists of four main components:
DFDs can present from simple overviews to complex, granular representations of a system or process, starting with level 0. The following is a breakdown of the different levels of DFDs:
DFDs can be created using specialized software such as Visio, online tools such as Draw.io or Lucidchart, or manual drawing. The process of creating a DFD involves several steps:
Let’s consider an example of a simple account management system. This system has an external entity: the user interacting with it. The user can either log in or register. The account management system validates user information and updates the records.
A simple context and level 1 diagram for the account management system would look like the following image:
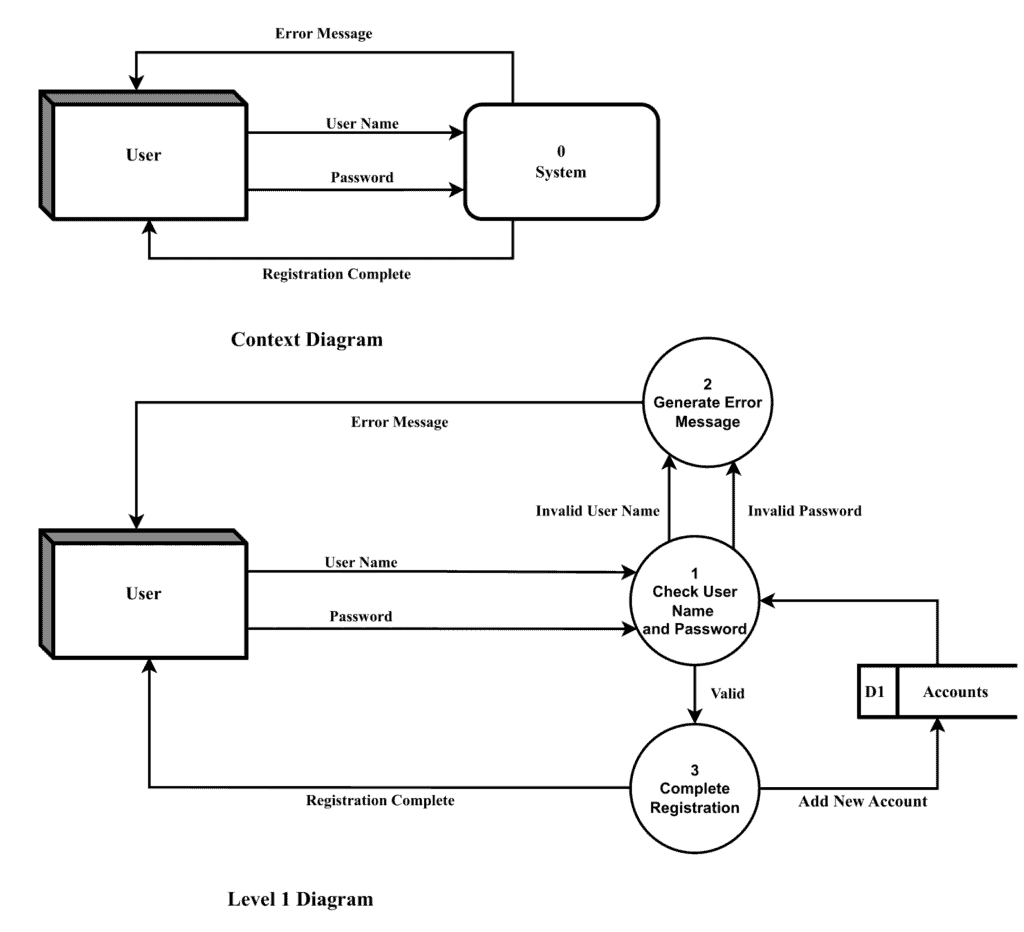
In this example, the external entities are represented as rectangles. The data flows are represented as arrows, and the processes are represented as circles. The data store is represented as a rectangle with one smaller side open. The context diagram gives a high-level overview of the system.
A user provides his/her user name to the system, and the system either returns an error or a message for successful registration. The level diagram breaks down the context diagram and includes three processes that check the user name and password, create an error message, or complete the registration. Process 1 retrieves data from the data store “D1-Accounts”, and process 2 adds the data in the form of user name and password.
In this article, we explored the DFD as a tool for understanding data flow within a system. They help to identify potential bottlenecks and communicate the structure of a system to stakeholders. Heterogeneous elements are employed to graphically represent the flow of data and its processing within the system.
DFDs can vary in complexity, starting with level 0 as the most basic and progressing to higher levels with more detailed information. While the higher-level DFDs can be helpful, they may only sometimes be necessary, and it’s essential to balance the level of detail with the overall purpose of the diagram.
By understanding the components of a DFD and the steps involved in creating it, we can deeply study the architecture of any system.