

Yes, we're now running our only Summer Sale. All Courses are 30% off until 20th July, 2026:
Learn through the super-clean Baeldung Pro experience:
>> Membership and Baeldung Pro.
No ads, dark-mode and 6 months free of IntelliJ Idea Ultimate to start with.
1. Introduction
In this tutorial, we’ll study how to represent relevant programming structures into a flowchart, thus exploring how to map an algorithm to a flowchart and vice-versa.
First, we’ll understand why using pseudocode and flowcharts to design an algorithm before actually implementing it with a specific programming language. Thus, we’ll explore the equivalence between pseudocode structures and flowchart elements. So, we’ll investigate some case studies. Finally, we’ll see a comparison between pseudocode and flowcharts in a systematic summary.
2. Designing Algorithms
As time passes, computer programs become more and more complex. In this way, many programming paradigms, structures, languages, and libraries appeared to deal with this increasing programming complexity.
With complex programs and multiple choices of resources to develop them, the decision-making of which means to use to solve a problem became a critical part of any programming project.
In such a scenario, textual and graphical designing tools were proposed to create software projects. Software projects abstract implementation details of production-intended programming languages. However, we still have logical compliance between these projects and any programming language.
Specific examples of algorithm designing tools are abstracted languages (textual) and flowcharts (graphical). Let’s see relevant concepts about them in the following subsections.
2.1. Textual Design Tools
The idea behind textual design tools is to simplify the rigorous programming languages tokens and structure, getting close to natural language. However, it does not mean that textual design tools are not free from ambiguity or can not precisely define the routines of an algorithm.
A very well-known example of a textual design tool is pseudocode. Pseudocode abstracts programming structures by redefining them with a simpler lexicon/syntax, which is typically closer to the natural and native language of the programmers.
In this way, we can find pseudocode in several different natural languages. Moreover, it is relevant to highlight that pseudocode may consider the structures of a programming language in special.
Another example is the Program Design Language (PDL). Actually, PDL is very similar to pseudocode since it aims to design an algorithm unambiguously. But, unlike pseudocode, PDL is just a structured English language, not considering any specific programming language structures.
2.2. Graphical Design Tools
Graphical tools aim to precisely and unambiguously define algorithms, as text design tools do. However, instead of using text, these tools adopt standard graphic elements representing different operations and resources of an algorithm.
A widely accepted graphic representation of algorithms in software projects is called flowcharts.
With flowcharts, we can depict resources, operations, conditionals, loopings, and data flows. So, we naturally map flowcharts to PDL, pseudocode, and programming languages (and vice-versa).
However, we need standard illustrations indicating programming operations and resources to draw flowcharts in a universally recognized way. In such a manner, the ISO 5807 was published defining element illustrations for flowcharts.
Besides the illustrations, the ISO 5807 indicates the correct form to name and use the elements to develop a complete and accurate flowchart.
Next, we’ll understand the equivalence of pseudocode structures to flowchart elements, besides the mapping process between them.
3. Flowchart Elements and Peseudocode Structures
As previously stated, programming structures of pseudocode have, in most cases, a direct mapping to flowchart elements. Even when there is no direct mapping, the flowchart elements relate to some operational aspects of pseudocode. Let’s see how it happens.
3.1. Terminator
According to ISO 5807, every flowchart has a starting and ending element, which we call a terminator. The illustration of the terminator element follows:
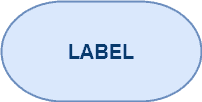
Terminators occur only twice in a flowchart: to indicate the beginning of the logical flows or determine the ending of the same logical flows. Both occurrences of this element are mandatory.
Making an analogy with pseudocode, terminators indicate the bounds of a program, subroutine, or function.
3.2. Manual Input
Elements that indicate data provided to a software program by manual means. Manual inputs are optional elements and can occur several times in the same flowchart.
The following image depicts the symbol of manual inputs:

In practice, we can understand manual inputs as data provided through, for example, push buttons, barcode readers, and (most commonly) keyboards. In pseudocode, reading operations that involve the user translates to manual inputs.
3.3. Process
Processes represent the execution of operations that manipulates data. Thus, a process execution usually changes data values, form, or location. This element is optional and may happen many times in flowcharts.
The image below depicts the symbol used for process elements:

Any data manipulation in pseudocode maps to processes in flowcharts. So, arithmetic operations and assignment operations, for instance, are candidates to define a processing element.
3.4. Display
The display element indicates data exhibited in any medium that makes it accessible to the users. This element is optional and employable several times in the same flowchart.
Next, we have the image that depicts the display element:
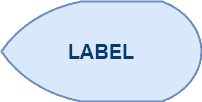
The most representative equipment of a display element is the computer screen. Thus, we can map printing operations defined in pseudocode to flowcharts’ display elements.
3.5. Decision
Decision elements are conditional constructs in a flowchart. In this way, decisions have a single entry point but many possible exits. So, choosing one of these exits undergoes evaluations of conditions defined within the element.
This element is optional, and we can have multiple occurrences in a flowchart.
The following image shows the symbol of a decision element:
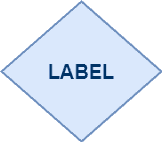
Conditional constructs of pseudocode can be directly mapped to decision elements in flowcharts. Examples are the if, if-else, and switch-case logical blocks.
3.6. Predefined Process
Predefined processes represent a process defined elsewhere. In typical cases, predefined processes express routines described as other flowcharts. This element is optional, and we can use it many times in a flowchart.
The image that illustrates a predefined process element in a flowchart follows:

In pseudocode, subroutines and functions frequently produce a flowchart by themselves. So, other routines that call these functions and subroutines can employ predefined process elements to refer to these other flowcharts.
3.7. Connector
Connector elements make it possible to split a flowchart into multiple segments. Thus, connectors link these different flowchart segments, presenting the logical order between them.
Furthermore, connectors are often used to merge flow lines (see more about them in the following subsection) into a single line. It may occur, for example, after the definition of conditionals.
Connectors are optional elements, having from zero to several occurrences in flowcharts.
The following image depicts the symbol of connectors:
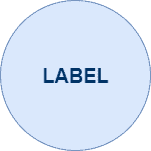
A practical example of a connector usage scenario is defining an if-else logical block in pseudocode. The execution flow returns to a common point after executing an if or else block. So, we can merge the different execution flows from conditionals into a single one with connectors.
3.8. Line
Lines indicate the relations between elements, creating the possible execution flows in a flowchart. Moreover, lines have an arrowed side specifying the execution flow direction.
Lines are mandatory elements, with at least one occurrence in a flowchart.
We have the available symbols to define a line element depicted next:
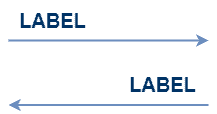
We do not have specific pseudocode constructs to exemplify a line. Actually, the manner in that we write pseudocode already defines its execution flows. So, it also determines how lines will be placed in a flowchart.
3.9. Other Elements
The flowchart elements presented in the previous subsections are the most popular ones. However, we have many other flowchart elements tailored for other specific operations and resources.
For instance, we have elements of preparation, delay, storage, and comment.
All those elements are presented and defined in the ISO 5807 specification document.
4. Pseudocode/Flowchart Mapping Example
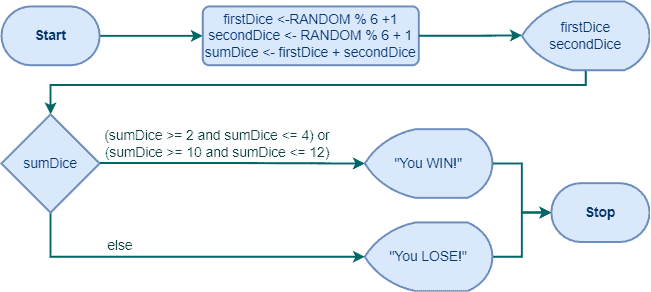
Let’s consider the implementation of a simplified craps game. In this game, we throw two dice and check the sum of the values: if the sum is 2, 3, 4, 10, 11, or 11, we won; in any other case, we lost.
The following pseudocode shows a simplified craps game algorithm:
algorithm SimplifiedCrapsGame():
    // This algorithm simulates a simplified version of the Craps game
    // by rolling two dice and determining win or loss based on their sum

    // We use a random() function to get the value for a die
    firstDice <- (random() mod 6) + 1
    secondDice <- (random() mod 6) + 1
    sumDice <- firstDice + secondDice
    print firstDice
    print secondDice
    if (2 <= sumDice <= 4) or (10 <= sumDice <= 12):
        print "You WIN!"
    else:
        print "You LOSE!"
Our objective is to map the simplified craps game algorithm to a flowchart. Thus, we’ll analyze the lines of the algorithm and identify the proper flowchart element to represent them.
First, we have lines 1, 2, and 3. These lines have arithmetic expressions and attribution operations. So, we are executing internal processes of the game to determine the dice values and the summing of them. In this way, we can map these lines to a process block.
Lines 4 and 5, in turn, execute operations to show the dice values for the user. Thus, since we have output operations, we can use a display block to represent them in the flowchart.
Lines 6 and 8, however, form a conditional if-else logical block. In such a manner, we can employ a decision element to depict it in the flowchart.
Finally, lines 7 and 9 are exhibition operations. So, we can also use display elements to represent them.
Of course, we delineate the algorithm bounds with the mandatory terminator elements and define the workflows with lines.
The following image shows the corresponding flowchart for the previously presented algorithm:
5. Systematic Summary
As software systems become more and more complex, new design tools emerged to support their projects in a standard and efficient way.
Some of these tools stood out. Examples are the textual tools of pseudocode and PDL and the graphical tools of flowcharts.
In particular, ISO 5807 proposed several elements to build flowcharts, providing their graphical representation and role standardization.
It is relevant to highlight that there are many design systems to create flowcharts. An example of a generic system in which we can do it is LaTeX.
The following table summarizes the most relevant flowchart elements and describes their meaning in a flowchart:
| Brief Definition | Symbol | Pseudocode Structures | |
|---|---|---|---|
| Terminator | Mandatory element; Indicates the beginning and the end of a flowchart | Ellipse | The boundaries of a function or program |
| Manual Input | Optional element; Indicates data input by manual means | Quadrilateral | Reading operations (e.g., input, scanf, cin, …) |
| Process | Optional element; Means operation that manipulate data | Rectangle | Assignments, arithmetic operations |
| Display | Optional element; Represents data output operations | Kite | operations… |
| Decision | Optional element; Consists of conditional constructs that can split the workflow | Rhombus | Conditional constructs (e.g., if-else, switch-case) |
| Predefined Process | Optional Element; Indicates Processes and routines defined elsewhere | Overlapping Rectangles | Sub-routines and functions |
| Connector | Optional Element; Represents a split point in the flowchart | Circle | — |
| Line | Mandatory Element; Shows the execution flows of a flowchart | Arrows | The execution order of pseudocode operations |
6. Conclusion
In this tutorial, we studied flowcharts. First, we reviewed concepts of algorithm design tools, including both the textual and graphical ones. Thus, we explored the flowchart elements (according to the ISO 5807) and their relation with pseudocode structures. So, we saw the mapping process of an example pseudocode to a flowchart. Finally, we compiled relevant information on each studied flowchart element in a systematic summary.
We can conclude that flowcharts are great tools for describing algorithms. With them, we can create designs logically compliant with implementations employing production programming languages.