Learn through the super-clean Baeldung Pro experience:
>> Membership and Baeldung Pro.
No ads, dark-mode and 6 months free of IntelliJ Idea Ultimate to start with.
Last updated: March 11, 2023
In this tutorial, we’ll review the Central Limit Theorem (CLT), one of the most important results in probability theory.
First, we’ll explain the formal statement of the theorem, and discuss the related implications in the real world. Then we’ll illustrate an example of the Galton Board in order to better understand the CLT.
Let’s consider independent random variables,
(
), with means,
, and variances,
. The CLT states that as
, the sum
becomes a Gaussian random variable with mean
and variance
. This holds even if the original variables,
, aren’t normally distributed.
More simply, the CLT states that the sum of a large number of independent random variables, under fairly general conditions, is normally distributed.
The importance of the CLT stems from the fact that, in several real applications, a random variable is the sum of a large number of independent random variables. Thus, the CLT explains why the Gaussian probability distribution is observed so commonly in nature:
Another important consequence of CLT is observed when random sampling is performed. If we randomly pick a sufficiently large sample from a population, the sample mean will be normally distributed regardless of the distribution of the original population.
The CLT can be applied if the following conditions are met:
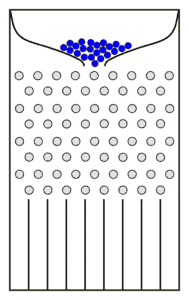
The Galton board, also known as the bean machine or quincunx, is a device invented by the English scientist Francis Galton to demonstrate the CLT.
The device consists of a vertical board with evenly spaced nails arranged in staggered order and placed in the upper half of the board; the lower half contains a certain number of evenly-spaced slots (bins). Glass covers the front of the device, allowing us to view the nails and slots. A funnel is placed in the middle of the upper edge.
The Galton board is schematically represented in the following figure:

A large number of balls are poured into the funnel and they fall through. Each time a ball hits a nail, it can bounce right or left with equal probability, since the nails are placed symmetrically. Finally, the balls are collected into the slots at the bottom. The filling of the slots closely approximates a bell curve.
Why is this bell distribution observed? The final position of each ball is a sum of random displacements to the right or left. Hence, the final position can be represented as a sum of discrete random variables, , with only two allowed values: 1 and -1, representing a bounce to the right or left, respectively.
The filling of the central bins is greater than the filling of the bins at the edges because there are more paths reaching the central bins than paths to the rightmost (or leftmost) bin.
It can be demonstrated that the filling of the slots follows a binomial distribution. If the number of rows and the number of balls are both sufficiently large, then the distribution approximates a Gaussian distribution according to the CLT.
In this article, we reviewed the Central Limit Theorem, a fundamental theorem of statistics. We explained the formal statement and the assumptions behind it. Then we discussed several real applications to highlight the importance of CLT. Finally, we examined the Galton board, a device invented ad hoc to demonstrate the CLT.