

Learn through the super-clean Baeldung Pro experience:
>> Membership and Baeldung Pro.
No ads, dark-mode and 6 months free of IntelliJ Idea Ultimate to start with.
Last updated: July 30, 2024
Learn through the super-clean Baeldung Pro experience:
>> Membership and Baeldung Pro.
No ads, dark-mode and 6 months free of IntelliJ Idea Ultimate to start with.
Visualizing software architecture is crucial for understanding, designing, and communicating the structure and dynamics of a software system. Simon Brown’s C4 model is a framework that allows us to visualize the architecture of software systems in a clear and structured manner. It provides different levels of abstraction to help various stakeholders understand the architecture from their perspective.
In this tutorial, we’ll explore the C4 model and its components and provide examples to illustrate its usage.
The C4 model breaks down software architecture into four levels of abstraction:
These levels help understand and communicate different aspects of the software architecture to different stakeholders.
Let’s first discuss the context diagram. This is where we get a bird’s-eye view of our system and see how it interacts with the world. It’s perfect for explaining the big picture to non-technical users.
Let’s say we’re building an online banking system. Our context diagram might look something like this: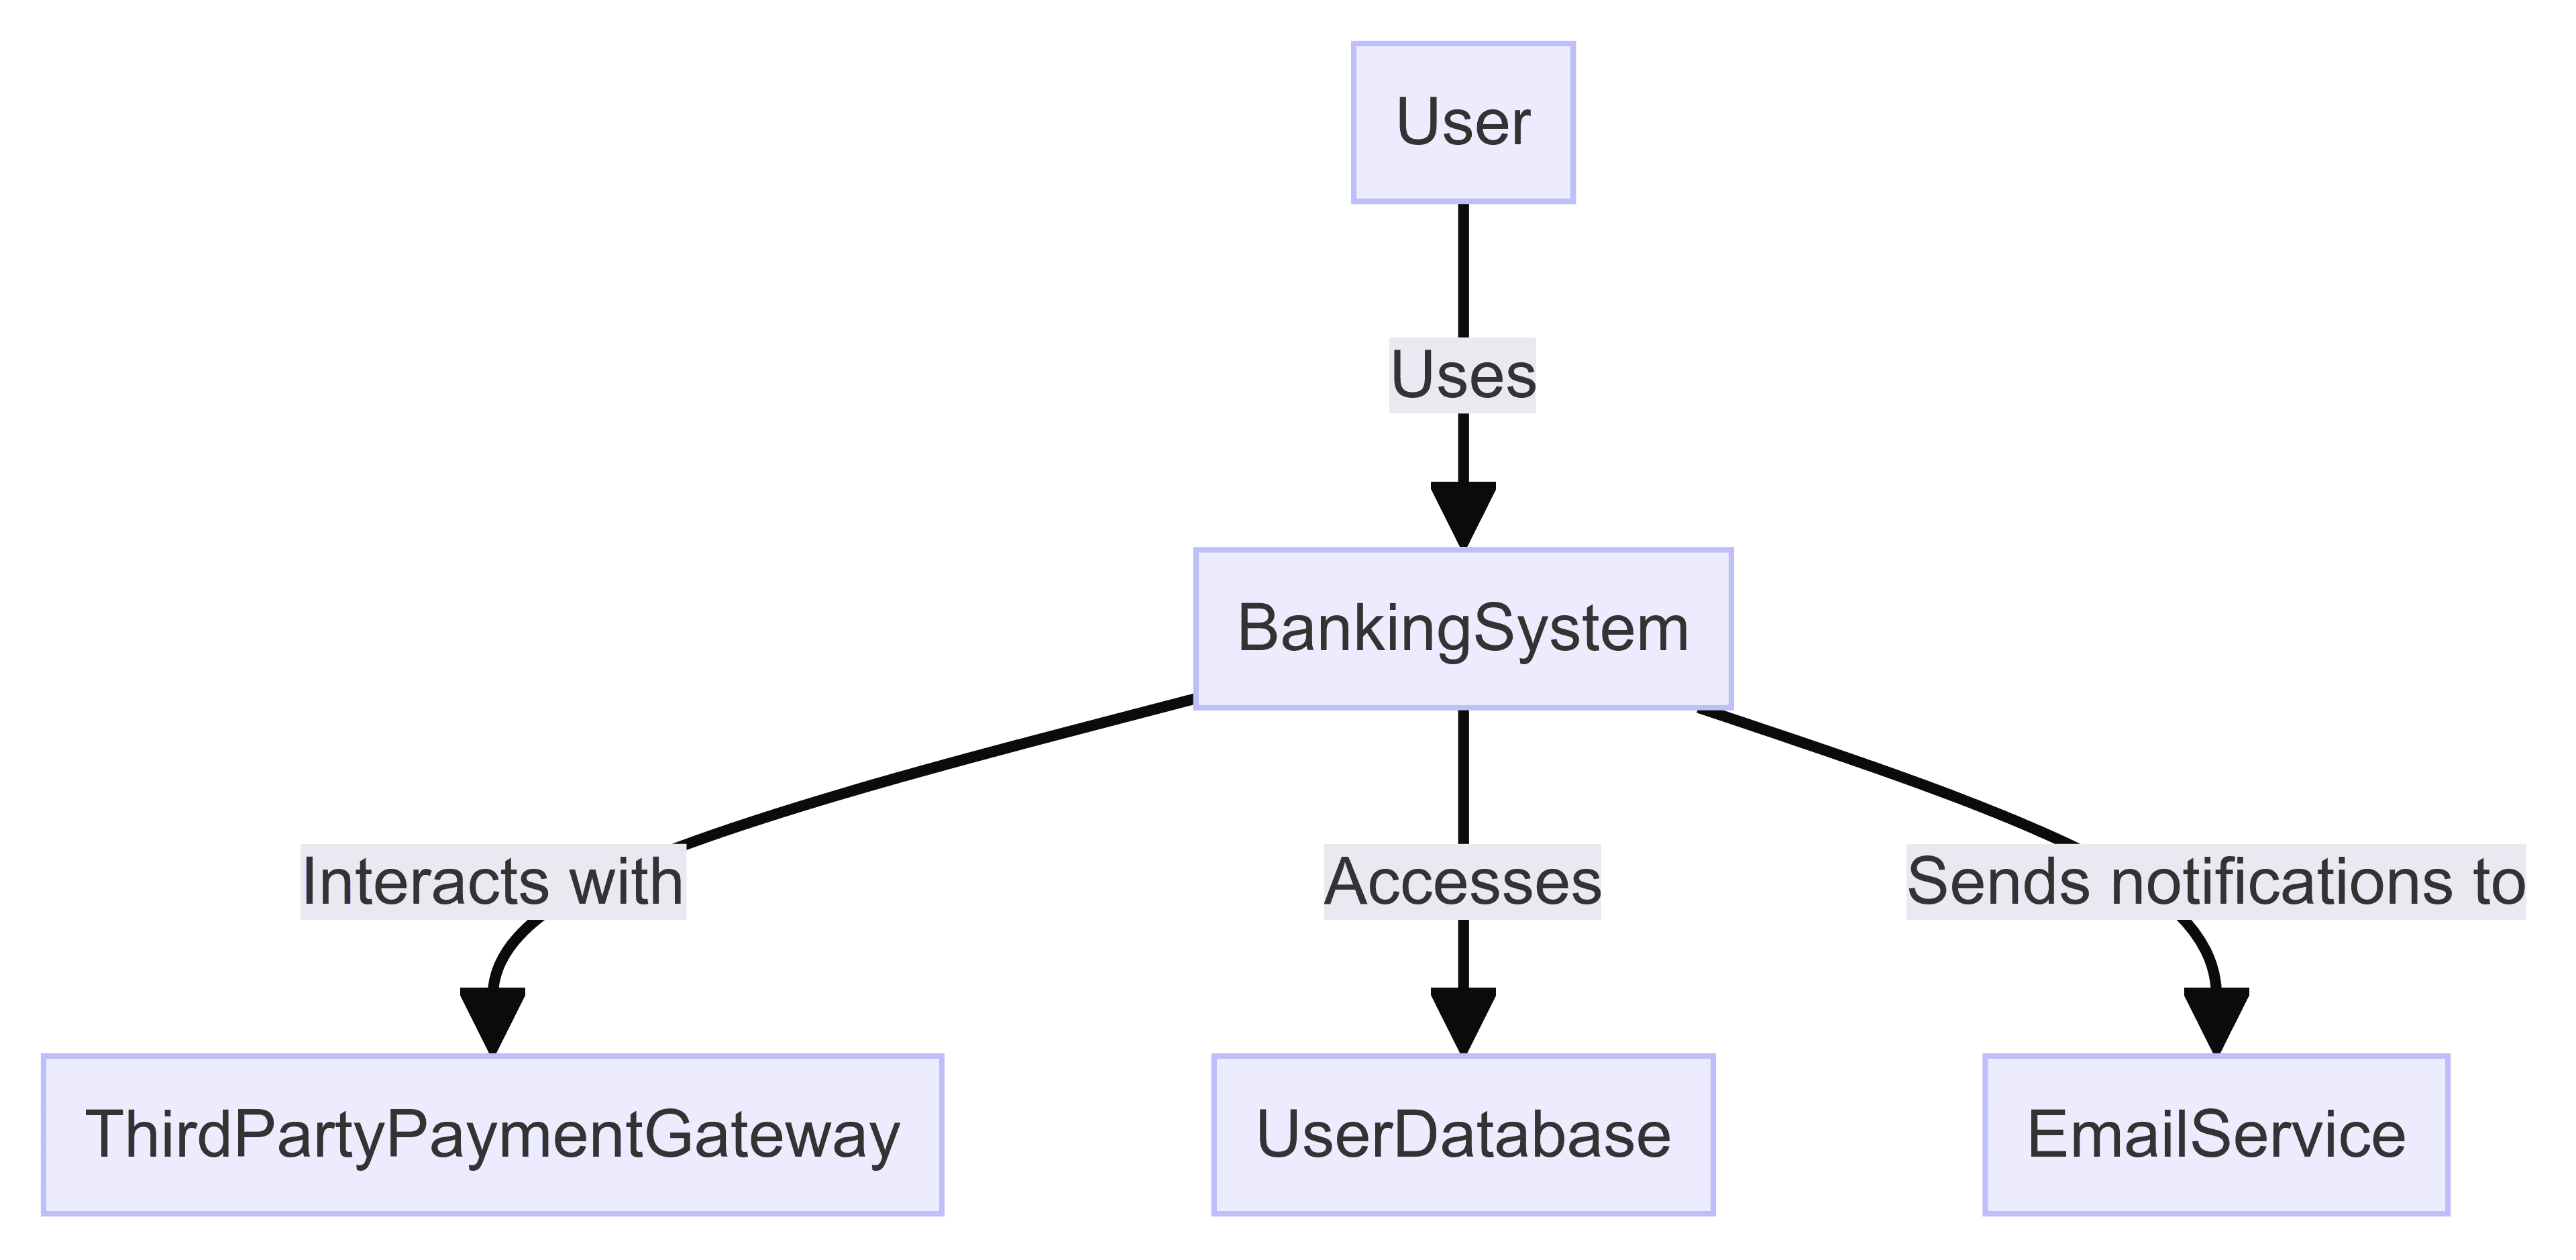
In this setup:
The context diagram provides a simple, high-level view of the system and its interactions, which is perfect for explaining the system to non-techies.
It also helps us define the boundaries and relationships of our system.
Next up is the container diagram at the container level of abstraction. Here, we zoom in to see the major containers, such as apps, services, and databases. This view is for the clients who must understand the architecture and deployment.
Let’s come back to our example with an online banking system:
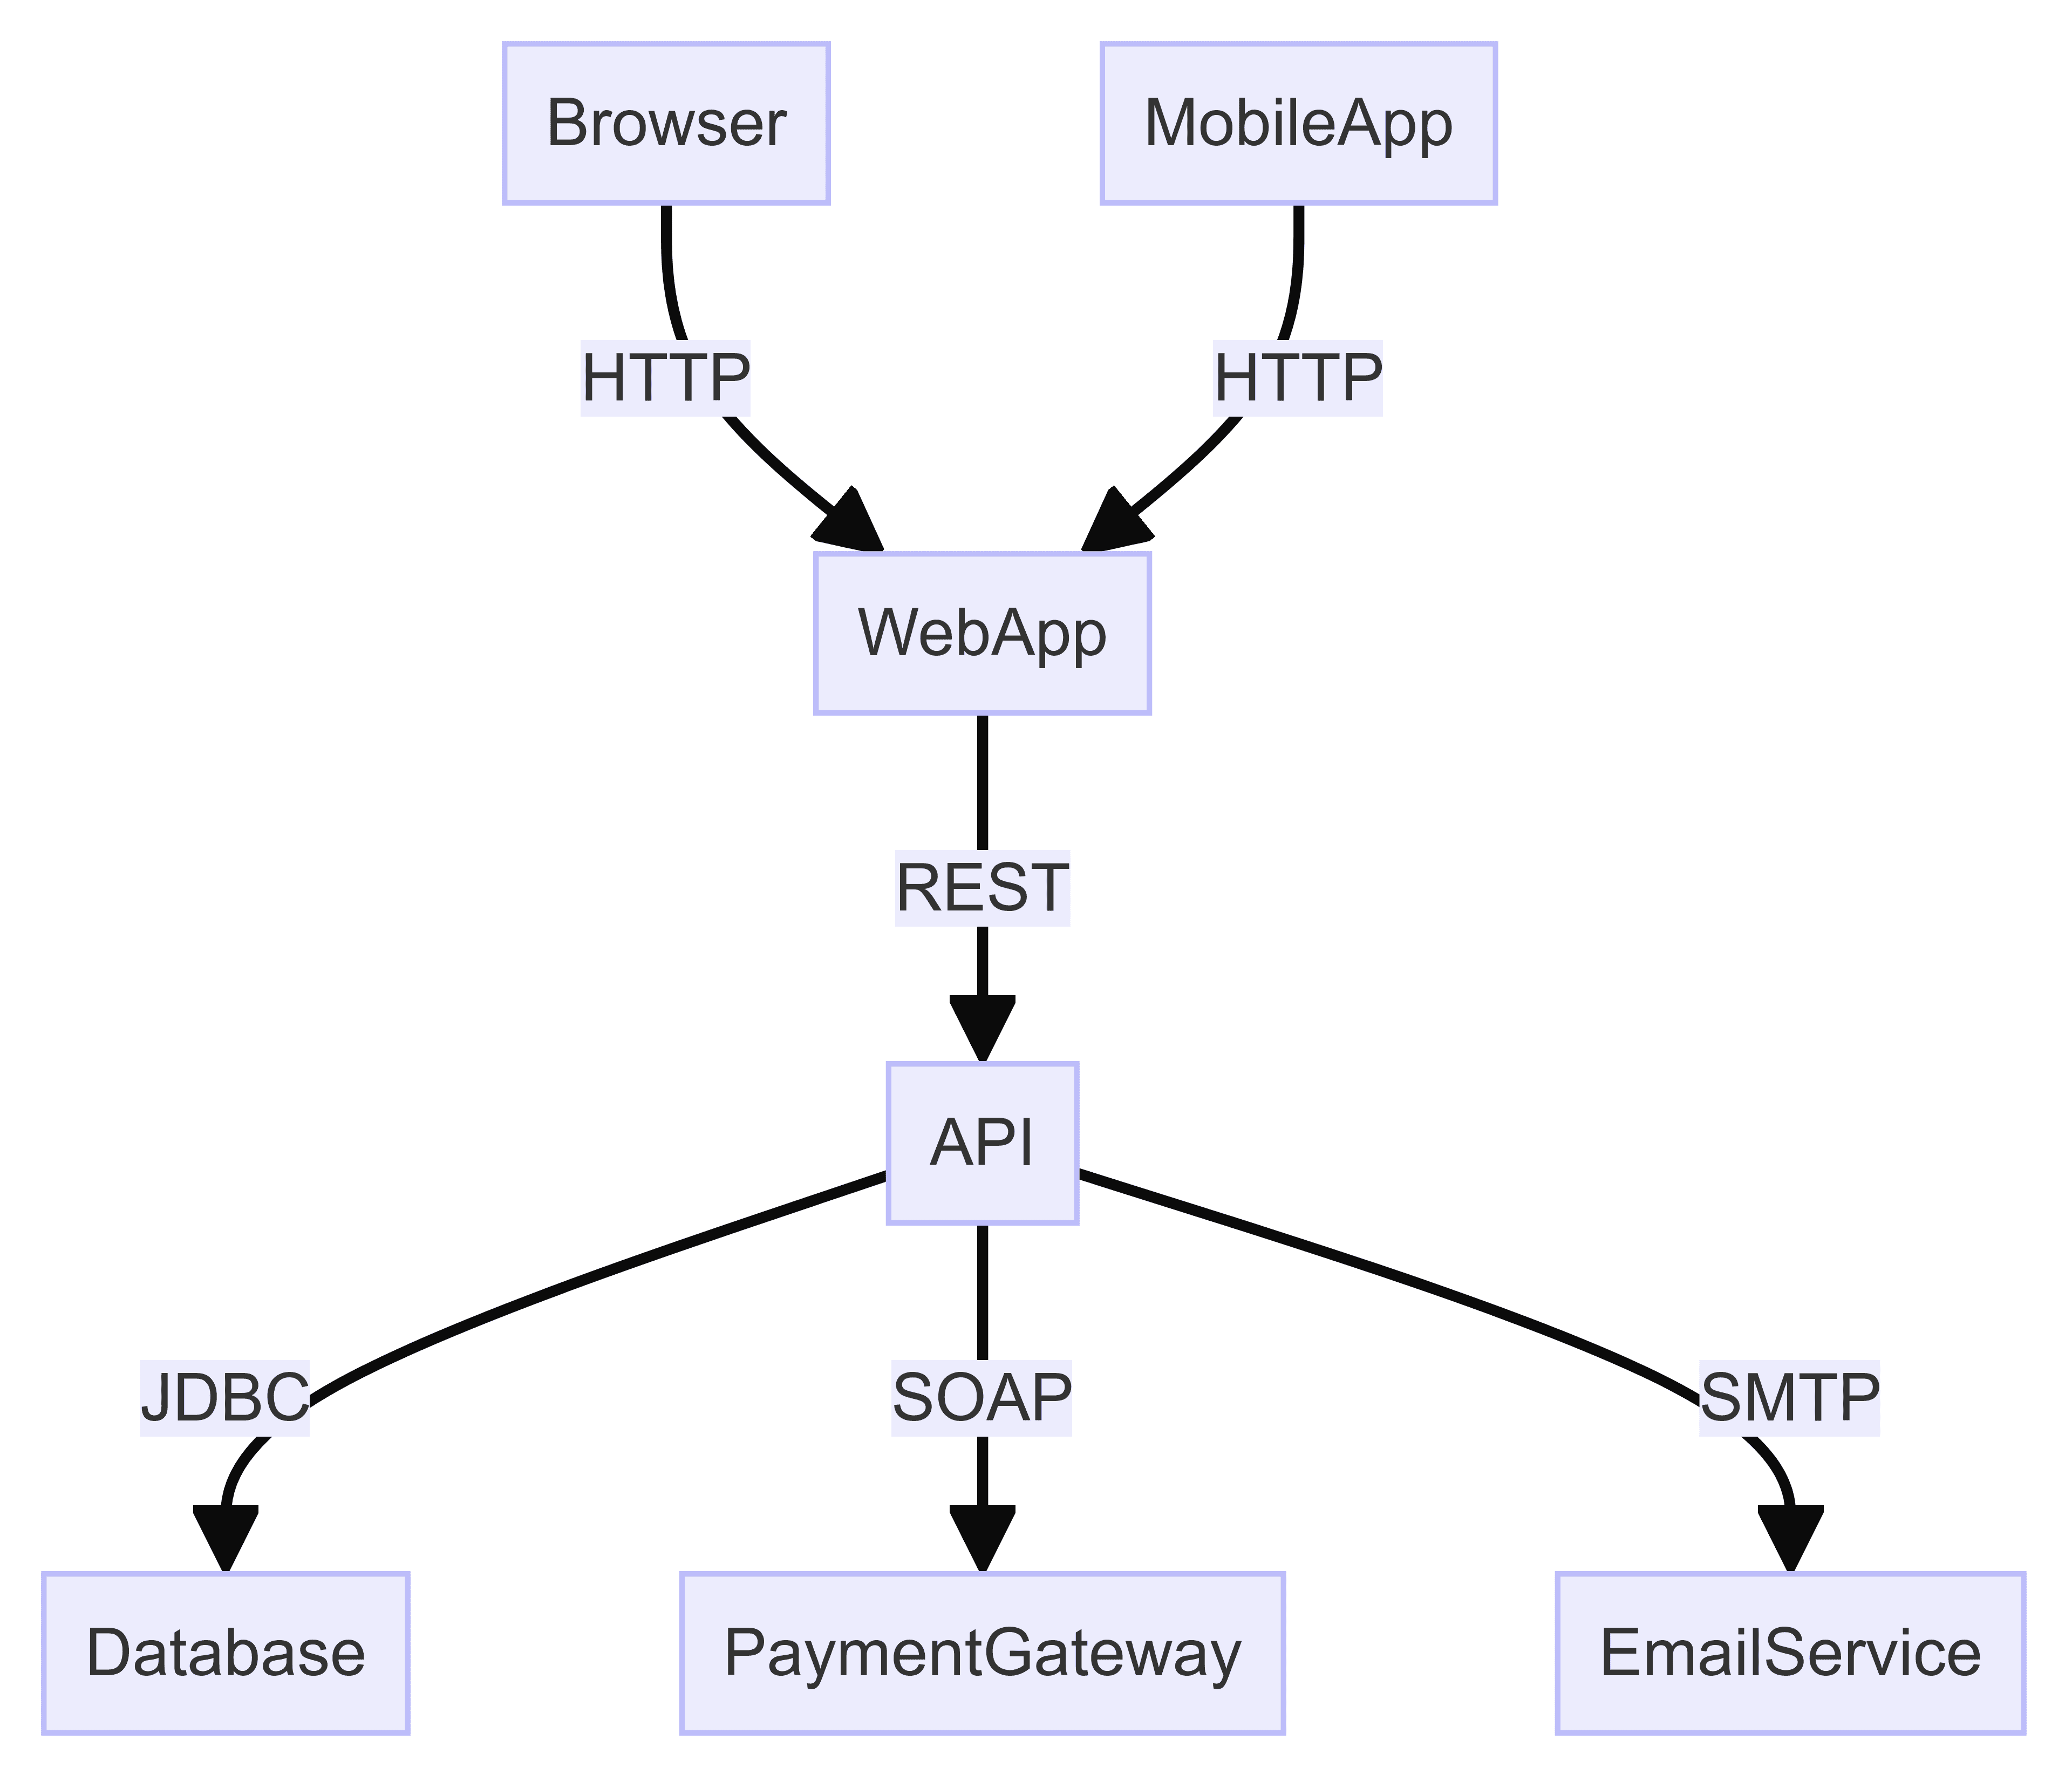
Here’s what’s happening:
The container diagram helps us see how the system is set up and how it works with other systems. It’s useful for technical talks and decisions because it explains how a system is put together and its main parts.
Now, let’s zoom in even further with the component diagram. This one breaks down each container to show its internal components and their interactions. It’s ideal for developers and architects who need to understand the nitty-gritty details:
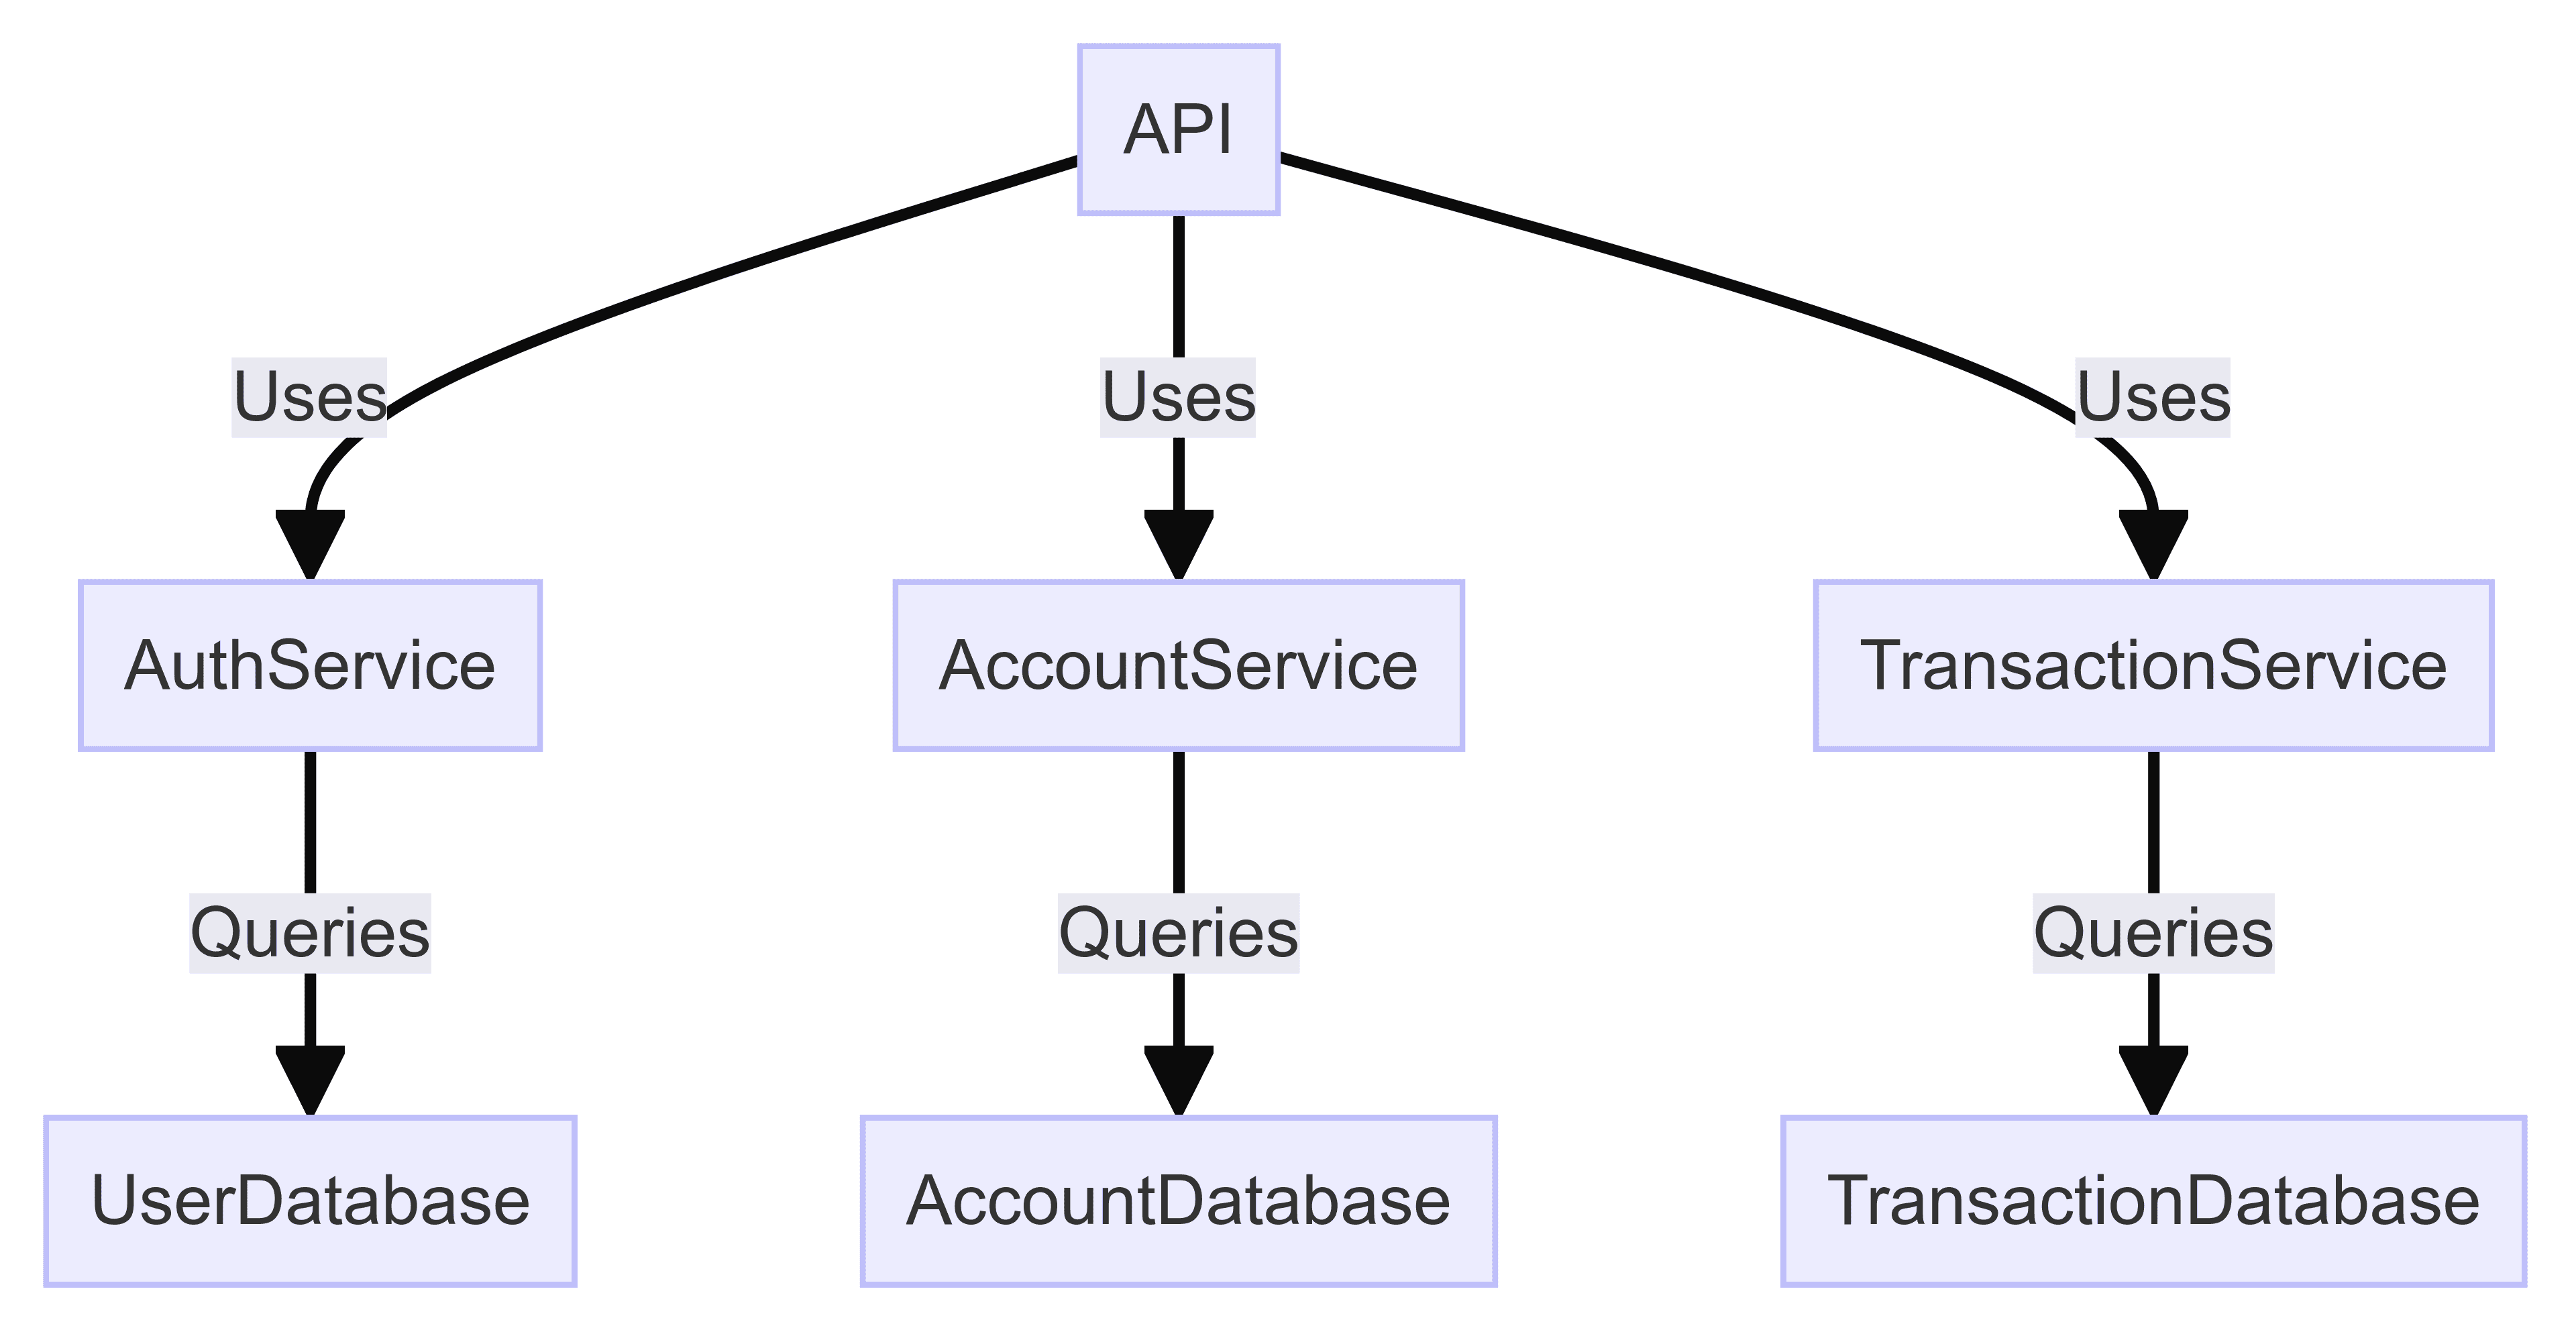
The diagram helps us better understand what’s inside each container by showing what each part is responsible for.
Component diagrams are handy for developers working on the code and keeping things running smoothly, especially when onboarding new team members.
Finally, we have the code diagram. This abstraction level is optional and shows the implementation details of individual components, like classes and methods. It’s aimed at developers who need to dive deep into the code.
In our example, we kept it a bit simpler, but we can always extend it with more info about all required classes and dependencies:
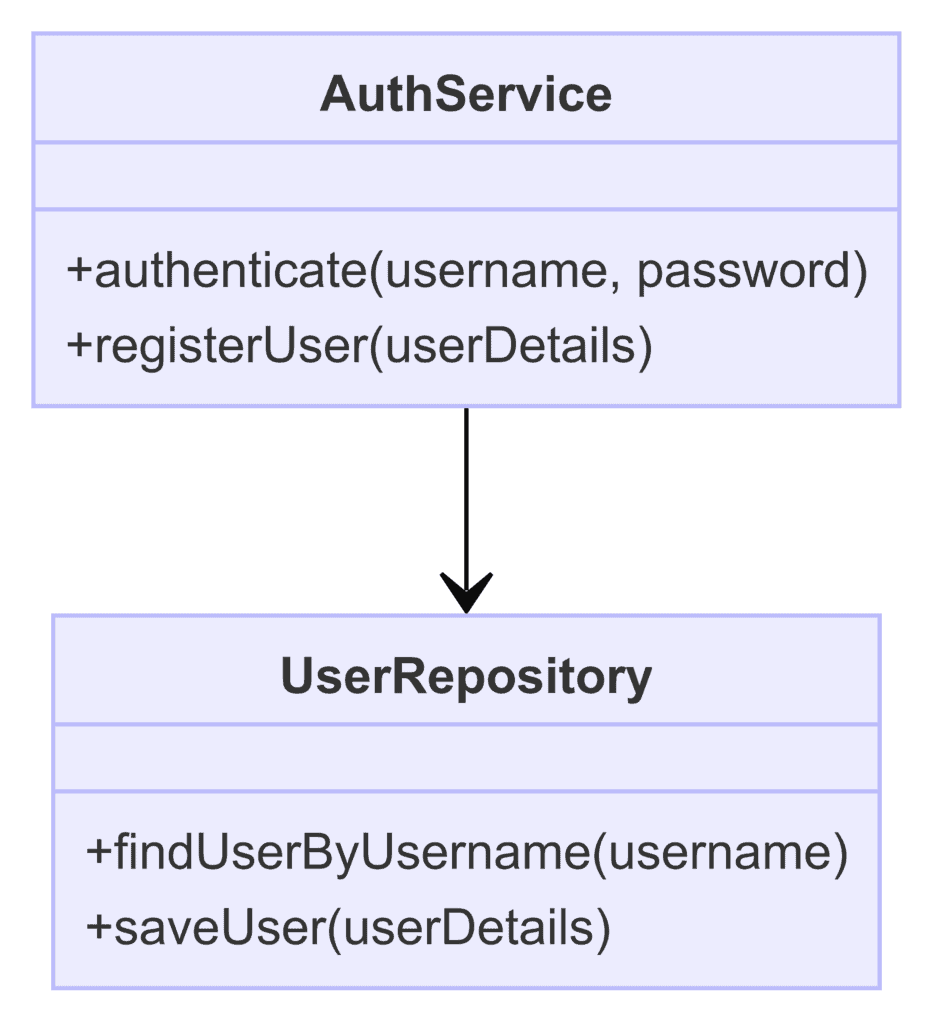
In the diagram above, we specified the security implementation details of AuthService and how it interacts with UserRepository.
We can use several models and frameworks to visualize software architecture. Each has strengths and weaknesses, and choosing which to use often depends on the project’s specific needs and the stakeholders involved.
Here, we’ll compare the C4 model with two other popular models: UML (Unified Modeling Language) and the 4+1 View Model.
UML is one of the most widely used modeling languages for software architecture.
It provides a variety of diagram types to represent different aspects of the system, such as class diagrams, sequence diagrams, use case diagrams, and more.
Philippe Kruchten introduced the 4+1 View Model, which organizes architecture into five views: logical, development, process, physical, and scenarios (use cases).
This model aims to address the concerns of different stakeholders by providing multiple perspectives on the system.
For example, using the C4 model for high-level architecture visualization and UML for detailed design can provide the best of both worlds. The key is to tailor the approach to the specific needs of the project and stakeholders:
| Aspect | C4 Model | UML | 4+1 View Model |
|---|---|---|---|
| Focus | Simplicity and clarity | Comprehensive detail | Multiple perspectives |
| Diagram Types | Four main types (Context, Container, Component, Code) | Wide range of types (class, sequence, use case, etc.) | Five views (logical, development, process, physical, scenarios) |
| Stakeholder Suitability | Non-technical and technical stakeholders | Primarily technical stakeholders | Both technical and non-technical stakeholders |
| Ease of Adoption | Easy to adopt and use | Requires understanding of UML notation | It can be complex to maintain |
| Scalability | Scales well for various project sizes | Detailed but can become overwhelming | Comprehensive but can be challenging to manage |
| Use Case Examples | High-level architecture, iterative documentation | Detailed design, formal documentation | In-depth architecture, detailed analysis |
So, in some cases, it may be beneficial to integrate aspects of different models.
With the right tools, we can create C4 diagrams in a breeze. Let’s explore some popular options that can help us efficiently create and manage these diagrams.
First, we have Structurizr, an online tool designed specifically for the C4 model. This tool is built with the C4 model in mind, ensuring that all diagrams align perfectly with the model’s principles.
What’s great about Structurizr is its support for collaborative editing, which allows teams to work together on diagrams in real time. Plus, it integrates smoothly with various development tools and repositories, making it easy to keep your architecture diagrams up-to-date with code changes.
Next, let’s talk about Lucidchart. This versatile diagramming tool supports a variety of diagram types, including C4. It offers an intuitive drag-and-drop interface, making it easy to create diagrams.
Lucidchart also has many templates and shapes tailored for different diagram types, including those needed for the C4 model. One of its standout features is real-time collaboration, including comments and version control, which is perfect for team projects.
Another fantastic tool is Draw.io, also known as diagrams.net. This open-source tool integrates well with platforms like Confluence and GitHub, making it a cost-effective and flexible choice.
Draw.io is completely free to use and offers various diagram types, making it versatile enough for any project. Its seamless integration with popular tools lets us easily include diagrams in our existing workflows.
If we prefer a text-based approach, PlantUML might be just what we need. It allows us to define diagrams using a simple and intuitive language and supports C4 model diagrams through extensions.
This tool is excellent for those who like to keep things under version control, as diagrams are created from text and can be easily managed alongside our code.
Additionally, PlantUML can generate diagrams automatically from code or other text descriptions, adding an extra convenience layer.
For those who need a more professional touch, Microsoft Visio is a solid choice.
Known for creating high-quality, professional diagrams, Visio is highly customizable and can be tailored to create C4 model diagrams. It integrates well with other Microsoft Office tools.
There are also a few additional tools worth mentioning.
Choosing the right tool for creating C4 diagrams depends on several factors.
We should consider how user-friendly the tool is and whether it requires extensive training. Does it support real-time collaboration and version control? Integration with our existing tools and workflows is also crucial. And, of course, the cost is always a factor – is the tool free, open-source, or does it require a subscription?
By evaluating these factors, we can choose the tool that best fits our team’s needs and workflow:
| Tool | Best For | Key Features |
|---|---|---|
| Structurizr | C4-specific features | Supports C4 model, integration with code |
| Lucidchart | Versatility and ease of use | Intuitive interface, collaborative features |
| Draw.io | Cost-effectiveness | Free to use, integrates with various platforms |
| PlantUML | Text-based approach | Simple syntax, version control friendly |
| Microsoft Visio | Professional quality | Advanced features, enterprise integration |
Whether we opt for Structurizr for its C4-specific features, Lucidchart for its versatility and ease of use, Draw.io for its cost-effectiveness, PlantUML for its text-based approach, or Microsoft Visio for its professional quality, there’s a tool out there to help us create clear and effective C4 diagrams.
We should choose the tool that fits our team’s needs and workflow based on the scenarios above.
In this article, we explored the C4 model for visualizing software architecture, highlighting its simplicity and clarity through Context, Container, Component, and Code diagrams.
The C4 model stands out for its ease of use compared to UML and the 4+1 View Model, making it an excellent choice for clear and concise architectural representation.
Integrating the C4 model into our processes allows us to design, communicate, and maintain complex systems more effectively.