

Mocking is an essential part of unit testing, and the Mockito library makes it easy to write clean and intuitive unit tests for your Java code.
Get started with mocking and improve your application tests using our Mockito guide:
Handling concurrency in an application can be a tricky process with many potential pitfalls. A solid grasp of the fundamentals will go a long way to help minimize these issues.
Get started with understanding multi-threaded applications with our Java Concurrency guide:
Spring 5 added support for reactive programming with the Spring WebFlux module, which has been improved upon ever since. Get started with the Reactor project basics and reactive programming in Spring Boot:
Since its introduction in Java 8, the Stream API has become a staple of Java development. The basic operations like iterating, filtering, mapping sequences of elements are deceptively simple to use.
But these can also be overused and fall into some common pitfalls.
To get a better understanding on how Streams work and how to combine them with other language features, check out our guide to Java Streams:
Explore Spring Boot 3 and Spring 6 in-depth through building a full REST API with the framework:
Yes, Spring Security can be complex, from the more advanced functionality within the Core to the deep OAuth support in the framework.
I built the security material as two full courses - Core and OAuth, to get practical with these more complex scenarios. We explore when and how to use each feature and code through it on the backing project.
You can explore the course here:
Spring Data JPA is a great way to handle the complexity of JPA with the powerful simplicity of Spring Boot.
Get started with Spring Data JPA through the guided reference course:
Refactor Java code safely — and automatically — with OpenRewrite.
Refactoring big codebases by hand is slow, risky, and easy to put off. That’s where OpenRewrite comes in. The open-source framework for large-scale, automated code transformations helps teams modernize safely and consistently.
Each month, the creators and maintainers of OpenRewrite at Moderne run live, hands-on training sessions — one for newcomers and one for experienced users. You’ll see how recipes work, how to apply them across projects, and how to modernize code with confidence.
Join the next session, bring your questions, and learn how to automate the kind of work that usually eats your sprint time.
Yes, we're now running our only Summer Sale. All Courses are 30% off until 20th July, 2026:
Yes, we're now running our only Summer Sale. All Courses are 30% off until 20th July, 2026:
1. Introduction
In this tutorial, we’ll understand how to work with event data and Apache Druid. We will cover the basics of event data and Druid architecture. As part of that, we’ll create a simple data pipeline leveraging various features of Druid that covers various modes of data ingestion and different ways to query the prepared data.
2. Basic Concepts
Before we plunge into the operation details of Apache Druid, let’s first go through some of the basic concepts. The space we are interested in is real-time analytics of event data on a massive scale.
Hence, it’s imperative to understand what we mean by event data and what does it require to analyze them in real-time at scale.
2.1. What Is Event Data?
Event data refers to a piece of information about a change that occurs at a specific point in time. Event data is almost ubiquitous in present-day applications. From the classical application logs to modern-day sensor data generated by things, it’s practically everywhere. These are often characterized by machine-readable information generated at a massive scale.
They power several functions like prediction, automation, communication, and integration, to name a few. Additionally, they are of significance in event-driven architecture.
2.2. What Is Apache Druid?
Apache Druid is a real-time analytics database designed for fast analytics over event-oriented data. Druid was started in 2011, open-sourced under the GPL license in 2012, and moved to Apache License in 2015. It’s managed by the Apache Foundation with community contributions from several organizations. It provides real-time ingestion, fast query performance, and high availability.
The name Druid refers to the fact that its architecture can shift to solve different types of data problems. It’s often employed in business intelligence applications to analyze a high volume of real-time and historical data.
3. Druid Architecture
Druid is a column-oriented and distributed data source written in Java. It’s capable of ingesting massive amounts of event data and offering low-latency queries on top of this data. Moreover, it offers the possibility to slice and dice the data arbitrarily.
It’s quite interesting to understand how Druid architecture supports these features. In this section, we’ll go through some of the important parts of Druid architecture.
3.1. Data Storage Design
It’s important to understand how Druid structures and stores its data, which allows for partitioning and distribution. Druid partitions the data by default during processing and stores them into chunks and segments:
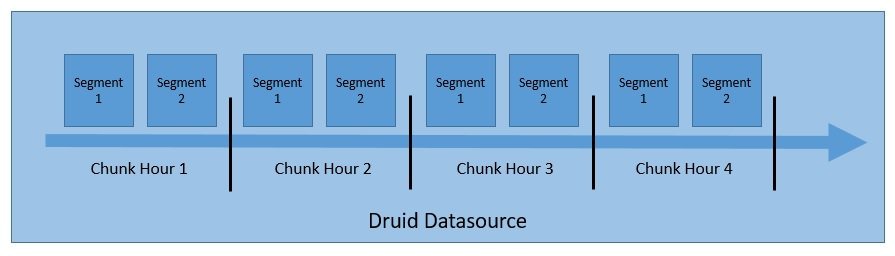
Druid stores data in what we know as “datasource”, which is logically similar to tables in relational databases. A Druid cluster can handle multiple data sources in parallel, ingested from various sources.
Each datasource is partitioned — based on time, by default, and further based on other attributes if so configured. A time range of data is known as a “chunk” — for instance, an hour’s data if data is partitioned by the hour.
Every chunk is further partitioned into one or more “segments”, which are single files comprising of many rows of data. A datasource may have anywhere from a few segments to millions of segments.
3.2. Druid Processes
Druid has a multi-process and distributed architecture. Hence, each process can be scaled independently, allowing us to create flexible clusters. Let’s understand the important processes that are part of Druid:
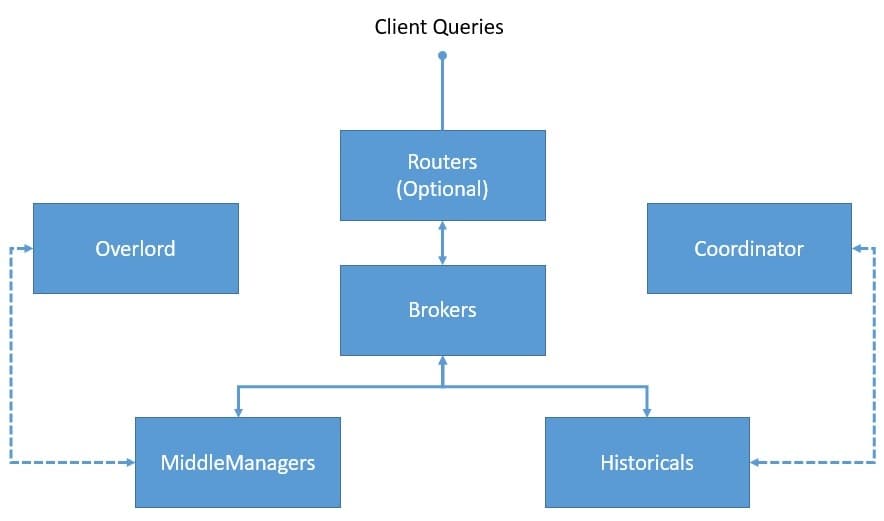
- Coordinator: This process is mainly responsible for segment management and distribution and communicates with historical processes to load or drop segments based on configurations
- Overlord: This is the main process that is responsible for accepting tasks, coordinating task distribution, creating locks around tasks, and returning status to callers
- Broker: This is the process to which all queries are sent to be executed in a distributed cluster; it collects metadata from Zookeeper and routes queries to processes having the right segments
- Router: This is an optional process that can be used to route queries to different broker processes, thus providing query isolation to queries for more important data
- Historical: These are the processes that store queryable data; they maintain a constant connection with Zookeeper and watch for segment information that they have to load and serve
- MiddleManager: These are the worker processes that execute the submitted tasks; they forward the tasks to Peons running in separate JVMs, thus providing resource and log isolation
3.3. External Dependencies
Apart from the core processes, Druid depends on several external dependencies for its cluster to function as expected.
Let’s see how a Druid cluster is formed together with core processes and external dependencies:
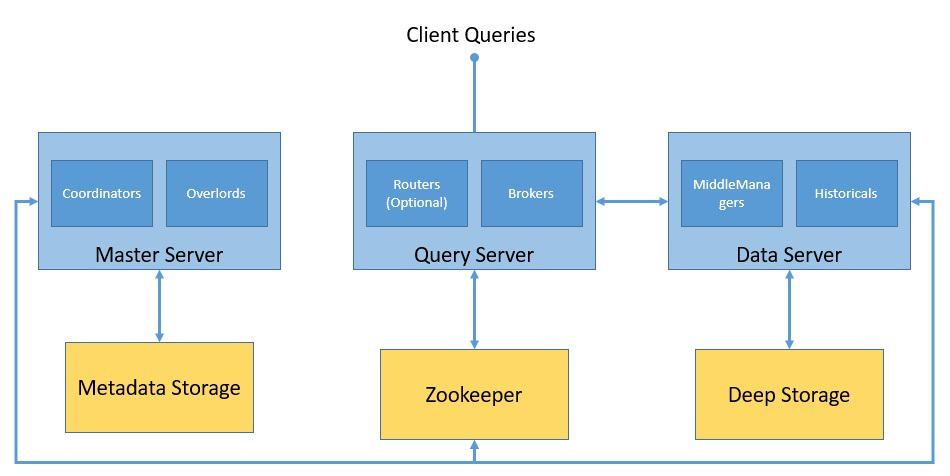
Druid uses deep storage to store any data that has been ingested into the system. These are not used to respond to the queries but used as a backup of data and to transfer data between processes. These can be anything from a local filesystem to a distributed object store like S3 and HDFS.
The metadata storage is used to hold shared system metadata like segment usage information and task information. However, it’s never used to store the actual data. It’s a relational database like Apache Derby, PostgreSQL, or MySQL.
Druid usage Apache Zookeeper for management of the current cluster state. It facilitates a number of operations in a Druid cluster like coordinator/overlord leader election, segment publishing protocol, and segment load/drop protocol.
4. Druid Setup
Druid is designed to be deployed as a scalable, fault-tolerant cluster. However, setting up a production-grade Druid cluster is not trivial. As we have seen earlier, there are many processes and external dependencies to set up and configure. As it’s possible to create a cluster in a flexible manner, we must pay attention to our requirements to set up individual processes appropriately.
Also, Druid is only supported in Unix-like environments and not on Windows. Moreover, Java 8 or later is required to run Druid processes. There are several single-server configurations available for setting up Druid on a single machine for running tutorials and examples. However, for running a production workload, it’s recommended to set up a full-fledged Druid cluster with multiple machines.
For the purpose of this tutorial, we’ll set up Druid on a single machine with the help of the official Docker image published on the Docker Hub. This enables us to run Druid on Windows as well, which, as we have discussed earlier, is not otherwise supported. There is a Docker compose file available, which creates a container for each Druid process and its external dependencies.
We have to provide configuration values to Druid as environment variables. The easiest way to achieve this is to provide a file called “environment” in the same directory as the Docker compose file.
Once we have the Docker compose and the environment file in place, starting up Druid is as simple as running a command in the same directory:
docker-compose upThis will bring up all the containers required for a single-machine Druid setup. We have to be careful to provide enough memory to the Docker machine, as Druid consumes a significant amount of resources.
5. Ingesting Data
The first step towards building a data pipeline using Druid is to load data into Druid. This process is referred to as data ingestion or indexing in Druid architecture. We have to find a suitable dataset to proceed with this tutorial.
Now, as we have gathered so far, we have to pick up data that are events and have some temporal nature, to make the most out of the Druid infrastructure.
The official guide for Druid uses simple and elegant data containing Wikipedia page edits for a specific date. We’ll continue to use that for our tutorial here.
5.1. Data Model
Let’s begin by examining the structure of the data we have with us. Most of the data pipeline we create is quite sensitive to data anomalies, and hence, it’s necessary to clean-up the data as much as possible.
Although there are sophisticated ways and tools to perform data analysis, we’ll begin by visual inspection. A quick analysis reveals that the input data has events captured in JSON format, with a single event containing typical attributes:
{
  "time": "2015-09-12T02:10:26.679Z",
  "channel": "#pt.wikipedia",
  "cityName": null,
  "comment": "Houveram problemas na última edição e tive de refazê-las, junto com as atualizações da página.",
  "countryIsoCode": "BR",
  "countryName": "Brazil",
  "isAnonymous": true,
  "isMinor": false,
  "isNew": false,
  "isRobot": false,
  "isUnpatrolled": true,
  "metroCode": null,
  "namespace": "Main",
  "page": "Catarina Muniz",
  "regionIsoCode": null,
  "regionName": null,
  "user": "181.213.37.148",
  "delta": 197,
  "added": 197,
  "deleted": 0
}
While there are quite a number of attributes defining this event, there are a few that are of special interest to us when working with Druid:
- Timestamp
- Dimensions
- Metrics
Druid requires a particular attribute to identify as a timestamp column. In most situations, Druid’s data parser is able to automatically detect the best candidate. But we always have a choice to select from, especially if we do not have a fitting attribute in our data.
Dimensions are the attributes that Druid stores as-is. We can use them for any purpose like grouping, filtering, or applying aggregators. We have a choice to select dimensions in the ingestion specification, which we’ll discuss further in the tutorial.
Metrics are the attributes that, unlike dimensions, are stored in aggregated form by default. We can choose an aggregation function for Druid to apply to these attributes during ingestion. Together with roll-up enabled, these can lead to compact data representations.
5.2. Ingestion Methods
Now, we’ll discuss various ways we can perform the data ingestion in Druid. Typically, event-driven data are streaming in nature, which means they keep generating at various pace over time, like Wikipedia edits.
However, we may have data batched for a period of time to go over, where data is more static in nature, like all Wikipedia edits that happened last year.
We may also have diverse data use cases to solve, and Druid has fantastic support for most of them. Let’s go over two of the most common ways to use Druid in a data pipeline:
- Streaming Ingestion
- Batched Ingestion
The most common way to ingest data in Druid is through the Apache Streaming service, where Druid can read data directly from Kafka. Druid supports other platforms like Kinesis as well. We have to start supervisors on the Overload process, which creates and manages Kafka indexing tasks. We can start the supervisor by submitted a supervisor spec as a JSON file over the HTTP POST command of the Overload process.
Alternatively, we can ingest data in batch — for example, from a local or remote file. It offers a choice for Hadoop-based batch ingestion for ingesting data from the Hadoop filesystem in the Hadoop file format. More commonly, we can choose the native batch ingestion either sequentially or in parallel. It’s a more convenient and simpler approach as it does not have any external dependencies.
5.3. Defining the Task Specification
For this tutorial, we’ll set up a native batch ingestion task for the input data we have. We have the option of configuring the task from the Druid console, which gives us an intuitive graphical interface. Alternately, we can define the task spec as a JSON file and submit it to the overlord process using a script or the command line.
Let’s first define a simple task spec for ingesting our data in a file called wikipedia-index.json:
{
  "type" : "index_parallel",
  "spec" : {
    "dataSchema" : {
      "dataSource" : "wikipedia",
      "dimensionsSpec" : {
        "dimensions" : [
          "channel",
          "cityName",
          "comment",
          "countryIsoCode",
          "countryName",
          "isAnonymous",
          "isMinor",
          "isNew",
          "isRobot",
          "isUnpatrolled",
          "metroCode",
          "namespace",
          "page",
          "regionIsoCode",
          "regionName",
          "user",
          { "name": "added", "type": "long" },
          { "name": "deleted", "type": "long" },
          { "name": "delta", "type": "long" }
        ]
      },
      "timestampSpec": {
        "column": "time",
        "format": "iso"
      },
      "metricsSpec" : [],
      "granularitySpec" : {
        "type" : "uniform",
        "segmentGranularity" : "day",
        "queryGranularity" : "none",
        "intervals" : ["2015-09-12/2015-09-13"],
        "rollup" : false
      }
    },
    "ioConfig" : {
      "type" : "index_parallel",
      "inputSource" : {
        "type" : "local",
        "baseDir" : "quickstart/tutorial/",
        "filter" : "wikiticker-2015-09-12-sampled.json.gz"
      },
      "inputFormat" : {
        "type": "json"
      },
      "appendToExisting" : false
    },
    "tuningConfig" : {
      "type" : "index_parallel",
      "maxRowsPerSegment" : 5000000,
      "maxRowsInMemory" : 25000
    }
  }
}
Let’s understand this task spec with respect to the basics we’ve gone through in previous sub-sections:
- We have chosen the index_parallel task, which provides us native batch ingestion in parallel
- The datasource we’ll be using in this task has the name “wikipedia”
- The timestamp for our data is coming from the attribute “time”
- There are a number of data attributes we are adding as dimensions
- We’re not using any metrics for our data in the current task
- Roll-up, which is enabled by default, should be disabled for this task
- The input source for the task is a local file named wikiticker-2015-09-12-sampled.json.gz
- We’re not using any secondary partition, which we can define in the tuningConfig
This task spec assumes that we’ve downloaded the data file wikiticker-2015-09-12-sampled.json.gz and kept it on the local machine where Druid is running. This may be trickier when we’re running Druid as a Docker container. Fortunately, Druid comes with this sample data present by default at the location quickstart/tutorial.
5.4. Submitting the Task Specification
Finally, we can submit this task spec to the overlord process through the command line using a tool like curl:
curl -X 'POST' -H 'Content-Type:application/json' -d @wikipedia-index.json http://localhost:8081/druid/indexer/v1/taskNormally, the above command returns the ID of the task if the submission is successful. We can verify the state of our ingestion task through the Druid console or by performing queries, which we’ll go through in the next section.
5.5. Advanced Ingestion Concepts
Druid is best suited for when we have a massive scale of data to deal with — certainly not the kind of data we’ve seen in this tutorial! Now, to enable features at scale, Druid architecture must provide suitable tools and tricks.
While we’ll not use them in this tutorial, let’s quickly discuss roll-up and partitioning.
Event data can soon grow in size to massive volumes, which can affect the query performance we can achieve. In many scenarios, it may be possible for us to summarise data over time. This is what we know as roll-up in Druid. When roll-up is enabled, Druid makes an effort to roll-up rows with identical dimensions and timestamps during ingestion. While it can save space, roll-up does lead to a loss in query precision, hence, we must use it rationally.
Another potential way to achieve better performance at the face of rising data volume is distributing the data and, hence, the workload. By default, Druid partitions the data based on timestamps into time chunks containing one or more segments. Further, we can decide to do secondary partitioning using natural dimensions to improve data locality. Moreover, Druid sorts data within every segment by timestamp first and then by other dimensions that we configure.
6. Querying Data
Once we have successfully performed the data ingestion, it should be ready for us to query. There are multiple ways to query data in Druid. The simplest way to execute a query in Druid is through the Druid console. However, we can also execute queries by sending HTTP commands or using a command-line tool.
The two prominent ways to construct queries in Druid are native queries and SQL-like queries. We’re going to construct some basic queries in both these ways and send them over HTTP using curl. Let’s find out how we can create some simple queries on the data we have ingested earlier in Druid.
6.1. Native Queries
Native queries in Druid use JSON objects, which we can send to a broker or a router for processing. We can send the queries over the HTTP POST command, amongst other ways, to do the same.
Let’s create a JSON file by the name simple_query_native.json:
{
  "queryType" : "topN",
  "dataSource" : "wikipedia",
  "intervals" : ["2015-09-12/2015-09-13"],
  "granularity" : "all",
  "dimension" : "page",
  "metric" : "count",
  "threshold" : 10,
  "aggregations" : [
    {
      "type" : "count",
      "name" : "count"
    }
  ]
}
This is a simple query that fetches the top ten pages that received the top number of page edits between the 12th and 13th of September, 2019.
Let’s post this over HTTP using curl:
curl -X 'POST' -H 'Content-Type:application/json' -d @simple_query_native.json http://localhost:8888/druid/v2?prettyThis response contains the details of the top ten pages in JSON format:
[ {
  "timestamp" : "2015-09-12T00:46:58.771Z",
  "result" : [ {
    "count" : 33,
    "page" : "Wikipedia:Vandalismusmeldung"
  }, {
    "count" : 28,
    "page" : "User:Cyde/List of candidates for speedy deletion/Subpage"
  }, {
    "count" : 27,
    "page" : "Jeremy Corbyn"
  }, {
    "count" : 21,
    "page" : "Wikipedia:Administrators' noticeboard/Incidents"
  }, {
    "count" : 20,
    "page" : "Flavia Pennetta"
  }, {
    "count" : 18,
    "page" : "Total Drama Presents: The Ridonculous Race"
  }, {
    "count" : 18,
    "page" : "User talk:Dudeperson176123"
  }, {
    "count" : 18,
    "page" : "Wikipédia:Le Bistro/12 septembre 2015"
  }, {
    "count" : 17,
    "page" : "Wikipedia:In the news/Candidates"
  }, {
    "count" : 17,
    "page" : "Wikipedia:Requests for page protection"
  } ]
} ]
6.2. Druid SQL
Druid has a built-in SQL layer, which offers us the liberty to construct queries in familiar SQL-like constructs. It leverages Apache Calcite to parse and plan the queries. However, Druid SQL converts the SQL queries to native queries on the query broker before sending them to data processes.
Let’s see how we can create the same query as before, but using Druid SQL. As before, we’ll create a JSON file by the name simple_query_sql.json:
{
  "query":"SELECT page, COUNT(*) AS counts /
    FROM wikipedia WHERE \"__time\" /
    BETWEEN TIMESTAMP '2015-09-12 00:00:00' AND TIMESTAMP '2015-09-13 00:00:00' /
    GROUP BY page ORDER BY Edits DESC LIMIT 10"
}
Please note that the query has been broken into multiple lines for readability, but it should appear on a single line. Again, as before, we’ll POST this query over HTTP, but to a different endpoint:
curl -X 'POST' -H 'Content-Type:application/json' -d @simple_query_sql.json http://localhost:8888/druid/v2/sqlThe output should be very similar to what we achieved earlier with the native query.
6.3. Query Types
We saw, in the earlier section, a type of query where we fetched the top ten results for the metric “count” based on an interval. This is just one type of query that Druid supports, and it’s known as the TopN query. Of course, we can make this simple TopN query much more interesting by using filters and aggregations. But that is not in the scope of this tutorial. However, there are several other queries in Druid that may interest us.
Some of the popular ones include Timeseries and GroupBy.
Timeseries queries return an array of JSON objects, where each object represents a value as described in the time-series query — for instance, the daily average of a dimension for the last one month.
GroupBy queries return an array of JSON objects, where each object represents a grouping as described in the group-by query. For example, we can query for the daily average of a dimension for the past month grouped by another dimension.
There are several other query types, including Scan, Search, TimeBoundary, SegmentMetadata, and DatasourceMetadata.
6.4. Advanced Query Concepts
Druid offers some complex methods to create sophisticated queries for creating interesting data applications. These include various ways to slice and dice the data while still being able to provide incredible query performance.
While a detailed discussion of them is beyond the scope of this tutorial, let’s discuss some of the important ones like Joins and Lookups, Multitenancy, and Query Caching.
Druid supports two ways of joining the data. The first is the join operators, and the second is query-time lookups. However, for better query performance, it’s advisable to avoid query-time joins.
Multitenancy refers to the feature of supporting multiple tenants on the same Druid infrastructure while still offering them logical isolation. It’s possible to achieve this in Druid through separate data sources per tenant or data partitioning by the tenant.
And finally, query caching is the key to performance in data-intensive applications. Druid supports query result caching at the segment and the query result levels. Further, the cache data can reside in memory or in external persistent storage.
7. Language Bindings
Although Druid has excellent support for creating ingestion specs and defining queries in JSON, it may be tedious sometimes to define these queries in JSON, especially when queries get complex. Unfortunately, Druid doesn’t offer a client library in any specific language to help us in this regard. But there are quite a few language bindings that have been developed by the community. One such client library is also available for Java.
We’ll quickly see how we can build the TopN query we used earlier using this client library in Java.
Let’s begin by defining the required dependency in Maven:
<dependency>
    <groupId>in.zapr.druid</groupId>
    <artifactId>druidry</artifactId>
    <version>2.14</version>
</dependency>
After this, we should be able to use the client library and create our TopN query:
DateTime startTime = new DateTime(2015, 9, 12, 0, 0, 0, DateTimeZone.UTC);
DateTime endTime = new DateTime(2015, 9, 13, 0, 0, 0, DateTimeZone.UTC);
Interval interval = new Interval(startTime, endTime);
Granularity granularity = new SimpleGranularity(PredefinedGranularity.ALL);
DruidDimension dimension = new SimpleDimension("page");
TopNMetric metric = new SimpleMetric("count");
DruidTopNQuery query = DruidTopNQuery.builder()
  .dataSource("wikipedia")
  .dimension(dimension)
  .threshold(10)
  .topNMetric(metric)
  .granularity(granularity)
  .filter(filter)
  .aggregators(Arrays.asList(new LongSumAggregator("count", "count")))
  .intervals(Collections.singletonList(interval)).build();
After this, we can simply generate the required JSON structure, which we can use in the HTTP POST call:
ObjectMapper mapper = new ObjectMapper();
String requiredJson = mapper.writeValueAsString(query);
8. Conclusion
In this tutorial, we went through the basics of event data and Apache Druid architecture.
Further, we set up a primary Druid cluster using Docker containers on our local machine. Then, we also went through the process of ingesting a sample dataset in Druid using the native batch task. After this, we saw the different ways we have to query our data in Druid. Lastly, we went through a client library in Java to construct Druid queries.
We have just scratched the surface of features that Druid has to offer. There are several possibilities in which Druid can help us build our data pipeline and create data applications. The advanced ingestion and querying features are the obvious next steps to learn, for effectively leveraging the power of Druid.
Moreover, creating a suitable Druid cluster that scales the individual processes as per the need should be the target to maximize the benefits.


