

Learn through the super-clean Baeldung Pro experience:
>> Membership and Baeldung Pro.
No ads, dark-mode and 6 months free of IntelliJ Idea Ultimate to start with.
Learn through the super-clean Baeldung Pro experience:
>> Membership and Baeldung Pro.
No ads, dark-mode and 6 months free of IntelliJ Idea Ultimate to start with.
In this tutorial, we’ll explore Pinpoint, an open-source APM (Application Performance Management) software with excellent capabilities.
First, we’ll see its basic architecture and the fundamentals of its working parts. Then, we’ll look at a working example of live performance monitoring.
Let’s look at the architecture of Pinpoint:
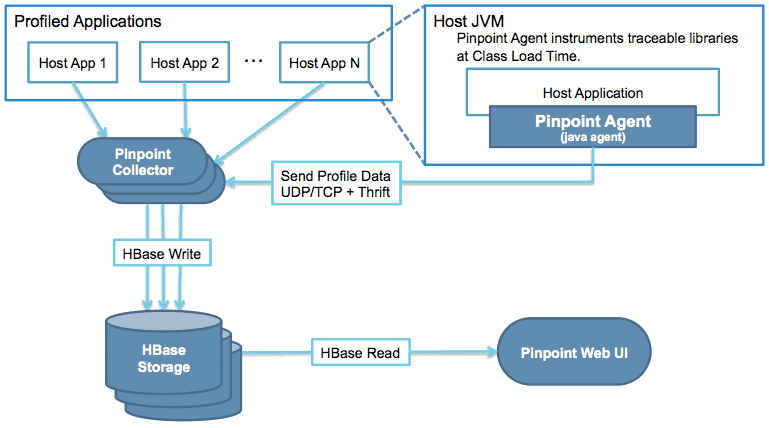
From this diagram, we can identify four main components:
The Pinpoint Collector is the pulsating heart of the software. It can collect data in two different ways. The first is by gathering data explicitly – applications call Pinpoint APIs directly in this case. The second one is automatic, relying on byte code instrumentation, which means that Pinpoint is modifying application code at class loading time, adding TCP/UDP network calls to the collector.
Let’s now run a quickstart example using an already-composed Pinpoint application environment using docker-compose:
$ git clone https://github.com/pinpoint-apm/pinpoint-docker.git
$ cd pinpoint-docker
$ docker-compose pull && docker-compose up -d
The last command can take some time to execute as it downloads and then brings up all the environments attached to the Pinpoint quickstart showcase.
Looking at the started containers at the end of the run, we see some additional components that are part of the infrastructure:
Let’s now hit some endpoints of the sample application, so that the APM has some metrics to track. At the address http://localhost:8085 we’ll be prompted with a list of endpoints we can call. For this demo, let’s make three HTTP requests by clicking these relative links:
Let’s now access the web client, at the address http://localhost:8080. Here, when we choose the “quickapp” application from the Application List, we’ll see this webpage:
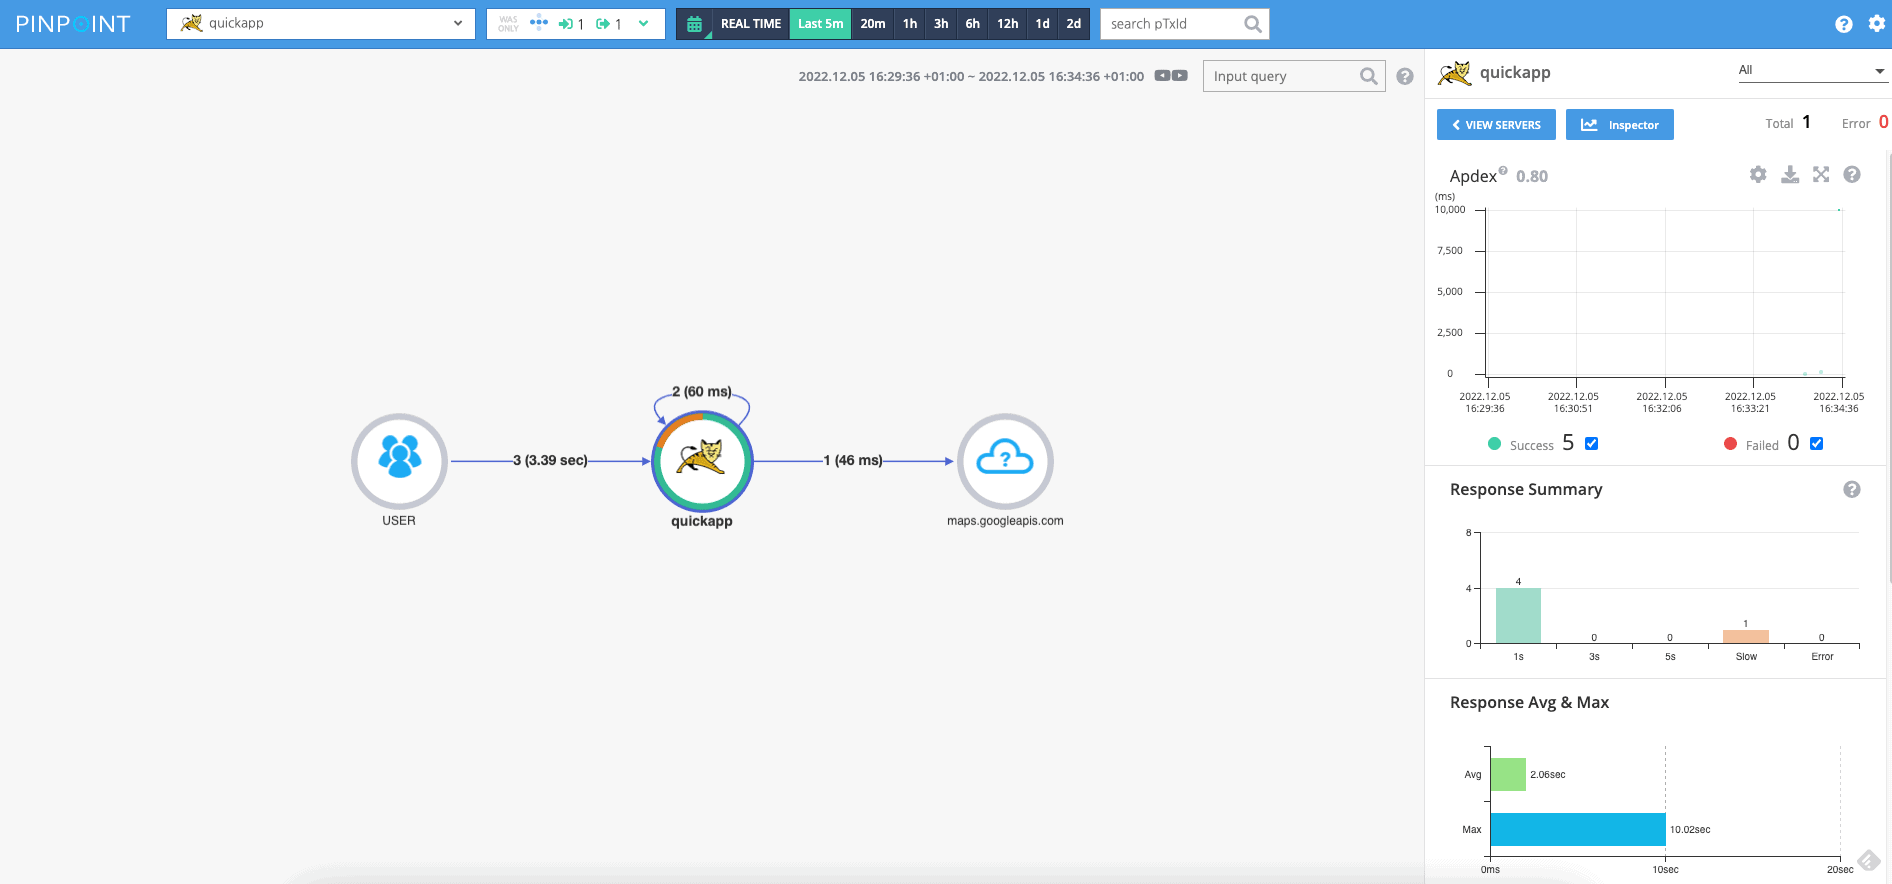
We can see clearly that we made three web requests, two that were resolved by the application itself, and one that went to an external service at maps.googleapis.com.
Furthermore, we can see from the color of the circle surrounding the application that one of those requests is considered “slow” because it has spent more than five seconds to finish.
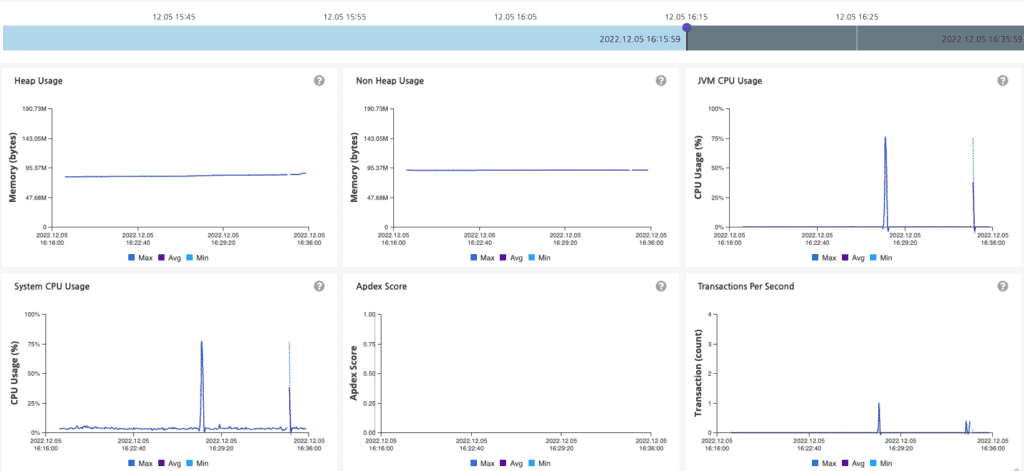
If we now click on “Inspector”, we can see a lot of details about the status of the Java Application, including memory, CPU, and response time:
We can access detailed information about every request registered by Pinpoint APM. By clicking and dragging the mouse on the Apdex Graph that’s present on the homepage, it’s possible to select some tracked requests:
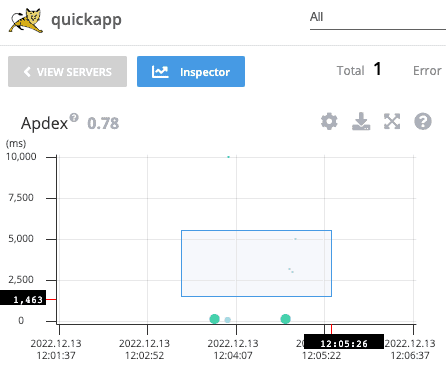
We then see in a new tab a list of all the various calls registered with detailed information in the Call Tree:
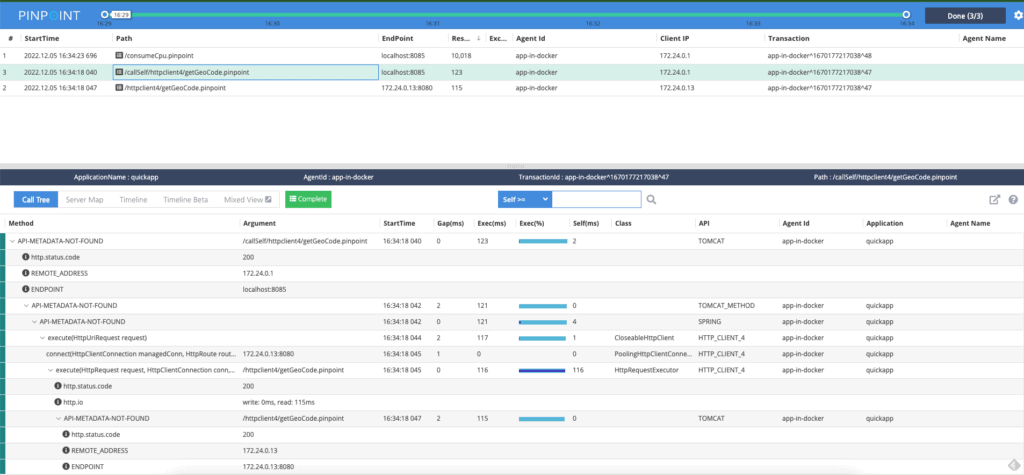
Using this graph, we can analyze the complete call stack for every request. This is useful to get visibility of the bottlenecks or slowdowns. It’s also great to check the unexpected behavior of external third-party applications.
It’s the Pinpoint JVM Agent that makes this detailed stack trace available to users. Let’s see how we started the monitored Java application:
pinpoint-quickstart:
   //...
   environment:
      JAVA_OPTS: -javaagent:/pinpoint-agent/pinpoint-bootstrap-${PINPOINT_VERSION}.jar ...
The JAVA_OPS environment variable is added in the docker-compose.yaml configures the JVM-monitored application to start with the Pinpoint Java Agent. The software then automatically and transparently instruments the bytecode to track every invocation during every context switch.
In this article, we’ve looked at Pinpoint APM, an open-source tool that helps us understand our application topology at a glance. We saw how to monitor every transaction in real-time in a non-invasive manner, through JVM agents and an external web collector.