

Learn through the super-clean Baeldung Pro experience:
>> Membership and Baeldung Pro.
No ads, dark-mode and 6 months free of IntelliJ Idea Ultimate to start with.
Learn through the super-clean Baeldung Pro experience:
>> Membership and Baeldung Pro.
No ads, dark-mode and 6 months free of IntelliJ Idea Ultimate to start with.
In this tutorial, we’ll explore OpenNMS, an enterprise-grade open-source network monitoring and management platform. OpenNMS is an open-source network monitoring platform that helps you visualize and monitor everything on your local and distributed networks. OpenNMS offers comprehensive fault, performance, and traffic monitoring with alarm generation in one place.
The OpenNMS Project was started in July, 1999 by Steve Giles, Brian Weaver, and Luke Rindfuss and has since evolved into a powerful solution used by hundreds of enterprises worldwide. We’ll examine its core features, installation process, and practical configuration examples that demonstrate real-world network monitoring scenarios.
Let’s discover why OpenNMS has become a preferred choice for network administrators seeking a flexible, scalable monitoring solution that integrates seamlessly with existing infrastructure.
Highly customizable and scalable, OpenNMS integrates with our core business applications and workflows. The platform follows a distributed architecture that can scale from monitoring a handful of devices to networks with tens of thousands of nodes.
OpenNMS consists of several key components working together. Let’s visualize the architecture using a sample component diagram:
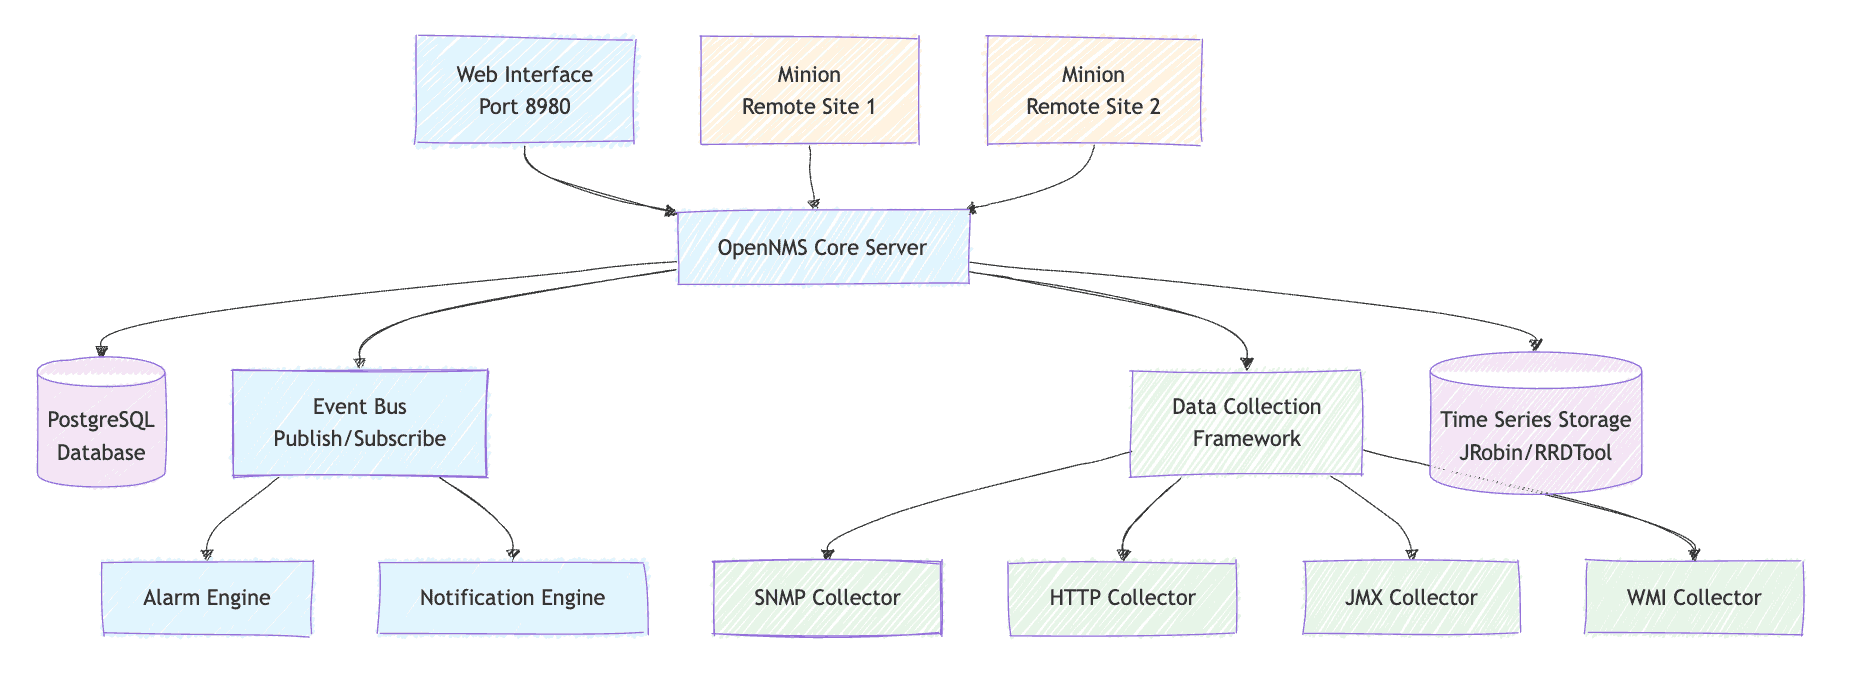
The Core server is a central engine that processes events, manages alarms, and coordinates all monitoring activities. It runs on a Java platform and uses PostgreSQL as its primary database.
We also have a comprehensive web-based interface/console that provides dashboards, configuration tools, and reporting capabilities. We can configure most features through the web UI or XML scripting, including thresholding, provisioning, event and flow management, service monitoring, and performance measurement.
Finally, data collection framework works with many industry-standard data collection protocols with no need for us to write or maintain third-party plugins: SNMP, JSON, WinRM, and others.
For large-scale deployments, OpenNMS supports distributed monitoring through components called Minions. We can use the OpenNMS Minion to monitor a service’s latency and availability from different perspectives.
This distributed approach enables monitoring of remote locations while maintaining centralized management and reporting.
Furthermore, OpenNMS is based around a “publish and subscribe” message bus. Processes within the software can publish events, and other processes can subscribe to them. This design allows for flexible workflow integration and custom extensions.
Let’s walk through installing OpenNMS Horizon, the community-supported distribution. Horizon is the free, community-supported, quick-release, open-source distribution of OpenNMS. It contains all of the newest features in development – a preview of the future of the platform.
To install it, we need to make sure, we have the latest JDK available in our system.
Let’s install OpenNMS on a Debian-based system:
# Add OpenNMS repository
echo 'deb https://debian.opennms.org stable main' | sudo tee /etc/apt/sources.list.d/opennms.list

# Import GPG key
wget -O - https://debian.opennms.org/OPENNMS-GPG-KEY | sudo apt-key add -

# Update package lists
sudo apt update
Now install OpenNMS:
# Install OpenNMS with PostgreSQL
sudo apt install opennms postgresql

# Start PostgreSQL service
sudo systemctl start postgresql
sudo systemctl enable postgresqlWe can now configure the PostgreSQL database for OpenNMS:
# Create OpenNMS database user
sudo -u postgres createuser -P opennms
# Enter password when prompted

# Create OpenNMS database
sudo -u postgres createdb -O opennms opennms
Let’s update the database connection configuration using the /usr/share/opennms/etc/opennms-datasources.xml file:
<jdbc-data-source name="opennms"
  database-name="opennms"
  class-name="org.postgresql.Driver"
  url="jdbc:postgresql://localhost:5432/opennms"
  user-name="opennms"
  password="your_password"/>
This datasource configuration connects OpenNMS to our PostgreSQL database. The JDBC URL specifies the database location and port, while the credentials match those we created earlier. OpenNMS uses this connection for storing device information, events, performance data, and all operational state information.
Let’s complete the OpenNMS setup process:
# Initialize database and detect system libraries
sudo /usr/share/opennms/bin/runjava -s
sudo /usr/share/opennms/bin/install -dis

# Start OpenNMS service
sudo systemctl start opennms
sudo systemctl enable opennms

# Check service status
sudo systemctl status opennms
The initialization process creates the database schema and detects system capabilities like available Java libraries. The install command with -dis flags performs database initialization and system detection in one step. Once started, OpenNMS becomes available on port 8980 and will automatically restart if the system reboots.
Once OpenNMS is running, we can access the web interface and configure our first monitoring targets.
First, we navigate to http://localhost:8980/opennms in our browser and then use the default admin/admin credentials.
Important: We need to change the default password immediately after our first login for security purposes.
OpenNMS provides multiple ways for us to add devices for monitoring. The provisioning system contains adapters to integrate with other processes within the application and with external software, such as a Dynamic DNS server and RANCID.
Let’s add a device using the web interface:
<model-import xmlns="http://xmlns.opennms.org/xsd/config/model-import"
  date-stamp="2025-07-22T10:00:00.000-05:00"
  foreign-source="example-network">
    <node node-label="router-01" foreign-id="1">
        <interface ip-addr="192.168.1.1"
          status="1"
          snmp-primary="P">
            <monitored-service service-name="ICMP"/>
            <monitored-service service-name="SNMP"/>
        </interface>
        <category name="Production"/>
        <category name="Routers"/>
    </node>
</model-import>
This provisioning configuration demonstrates how we define network devices for monitoring. The foreign-source acts as a logical grouping, while each node represents a physical device. The snmp-primary=”P” designation makes this interface the primary SNMP target, and the monitored services define what OpenNMS will check. Categories help organize devices for reporting and bulk operations.
Next, let’s configure SNMP monitoring for network devices using the /usr/share/opennms/etc/snmp-config.xml:
<snmp-config retry="3" timeout="3000"
  read-community="public"
  write-community="private"
  version="v2c">
    <definition version="v3"
      security-name="opennms-user"
      auth-passphrase="your-auth-password"
      privacy-passphrase="your-privacy-password">
        <range begin="192.168.1.0" end="192.168.1.255"/>
    </definition>
</snmp-config>
This SNMP configuration establishes communication parameters for network devices. The global settings provide fallback values, while the specific definition block configures SNMPv3 security for a subnet range. The authentication and privacy passphrases enable encrypted SNMP communication, significantly improving security over the default community strings.
We can create customizable dashboards that we can export as a PDF. Resource graphs, database reports, charts. The web interface allows us to create personalized views of network status and performance metrics:
OpenNMS also offers sophisticated features for enterprise-grade network monitoring.
For geographically distributed networks, we can deploy Minions at remote locations:
# Install Minion package
sudo apt install opennms-minion

# Configure Minion to communicate with OpenNMS
sudo systemctl edit opennms-minion
Installing a Minion creates a remote monitoring agent that can operate independently at distributed locations. The systemctl edit command opens a configuration overlay where we can specify the OpenNMS server location and authentication credentials, establishing a secure communication channel back to the central server.
Let’s set up performance thresholds to trigger alerts:
<thresholding-config>
    <group name="default" rrdRepository="/var/lib/opennms/rrd/snmp/">
        <threshold type="high"
          ds-name="ifHCInOctets"
          value="90000000"
          rearm="50000000"
          trigger="2"/>
    </group>
</thresholding-config>
This threshold configuration monitors network interface traffic and triggers alerts when incoming octets exceed 90 million per polling interval. The trigger=”2″ setting requires two consecutive violations before generating an alarm, reducing false positives. The rearm value specifies when the alarm should clear, creating hysteresis that prevents flapping between alarm states.
Let’s configure how OpenNMS sends alerts:
<notifications>
    <notification name="interfaceDown"
      status="on">
        <uei>uei.opennms.org/nodes/interfaceDown</uei>
        <rule>IPADDR != '0.0.0.0'</rule>
        <destinationPath>Email-Admin</destinationPath>
    </notification>
</notifications>
This notification rule automatically sends alerts when network interfaces go down. The uei (Unique Event Identifier) specifies which events trigger notifications, while the rule filters out loopback interfaces. The destinationPath determines how and where alerts are sent, connecting to separately configured email, SMS, or webhook destinations.
For production deployments, we should consider these optimization strategies.
We must configure the PostgreSQL max_connections setting to at least twice the maximum pool size in Horizon. The default maximum pool size value in Horizon is 50, but it applies to each connection in opennms-datasources.xml.
Let’s adjust PostgreSQL settings in postgresql.conf:
max_connections = 200
shared_buffers = 256MB
effective_cache_size = 1GB
work_mem = 4MB
These PostgreSQL optimizations tune the database for OpenNMS’s specific workload patterns. The increased max_connections value accommodates OpenNMS’s connection pooling, while shared_buffers allocates memory for frequently accessed data. The effective_cache_size value helps PostgreSQL’s query planner make better decisions, and work_mem provides sufficient memory for complex queries and sorting operations.
By default, OpenNMS uses JRobin for time series data. For better performance with large datasets, we can consider switching to RRDTool or Newts (Cassandra-based storage).
We can scale through Sentinels for flow persistence, through Minions for Flow, BMP, SNMP trap, and Syslog ingest, and through embedded ActiveMQ-to-Kafka message brokers.
OpenNMS provides multiple integration points for extending functionality.
The platform offers a comprehensive REST API for programmatic access:
curl -u admin:admin
  "http://localhost:8980/opennms/rest/nodes"
   -H "Accept: application/json"
This REST API call retrieves all monitored nodes in JSON format using basic authentication. The API provides programmatic access to all OpenNMS data and configuration, enabling integration with external systems, custom dashboards, or automated provisioning scripts. The response includes detailed node information, interface status, and current service states.
Our official plugin API provides a stable base for us to extend the configuration of Meridian, consume its outputs, and expose expanded functionality.
We can create custom plugins to extend OpenNMS capabilities for specific monitoring requirements or integration with proprietary systems.
We can define service dependencies and monitor business-critical services using the Business Service Monitoring feature. This allows us to correlate technical metrics with business impact.
In this article, we’ve explored OpenNMS as a comprehensive network monitoring solution that combines enterprise-grade capabilities with open-source flexibility. OpenNMS is a highly scalable open source network management platform with network traffic analysis, network discovery, alerting, and monitoring that can adapt to diverse network environments.