

Learn through the super-clean Baeldung Pro experience:
>> Membership and Baeldung Pro.
No ads, dark-mode and 6 months free of IntelliJ Idea Ultimate to start with.
Last updated: October 28, 2024
Learn through the super-clean Baeldung Pro experience:
>> Membership and Baeldung Pro.
No ads, dark-mode and 6 months free of IntelliJ Idea Ultimate to start with.
K9s provides a terminal-based user interface (TUI) for managing our Kubernetes clusters. While kubectl is the official go-to tool for interacting with the Kubernetes cluster, the k9s command complements it by providing a user interface in the terminal realm. Critically, k9s bridges the gap between command-line efficiency and graphical user interface clarity. It presents cluster information in a structured and easy-to-digest format.
In this tutorial, we’ll learn how to manage a Kubernetes cluster with the k9s command-line tool.
In this section, we’ll install the k9s command and then demonstrate the different arguments we can use to launch the TUI program.
To install K9s on our system, we can get the link to the compressed package from the release page on the K9s GitHub repository. Once we’ve obtained the link for the Linux binary, we can download and extract the file using wget and tar command-line tools:
$ wget https://github.com/derailed/k9s/releases/download/v0.32.5/k9s_Linux_amd64.tar.gz
$ tar -xzf k9s_Linux_amd64.tar.gz
The command above downloads the compressed k9s binary and saves it as k9s_Linux_x86_64.tar.gz. Then, we extract the contents of the tar file.
Finally, we move the k9s binary to the /usr/local/bin directory:
$ sudo mv k9s /usr/local/bin/By moving the binary into the /usr/local/bin directory, we can ensure that the k9s command is resolvable through the PATH variable.
Like kubectl, the k9s command-line tools read the .kube/config file in the home directory to obtain the cluster information. Therefore, we’ll first configure a cluster connection on our .kube/config file.
We can add the connection information for existing clusters to the .kube/config file using the kubectl config command or by editing the file directly.
For brevity, we’ll create a new Kubernetes cluster using the kind command-line tool that automatically populates the .kube/config file with the connection details:
$ kind create cluster
Creating cluster "kind" ...
 ✓ Ensuring node image (kindest/node:v1.31.0) 🖼
 ...
Set kubectl context to "kind-kind"
You can now use your cluster with:

kubectl cluster-info --context kind-kind
Subsequently, we can ensure that the context is properly set by running the kubectl config get-contexts command:
$ kubectl config get-contexts
CURRENT   NAME        CLUSTER     AUTHINFO    NAMESPACE
*         kind-kind   kind-kind   kind-kind
The kubectl config get-contexts command returns a list of contexts in our .kube/config file.
To launch k9s, we can enter the k9s command in our terminal:
$ k9sWithout any command-line arguments, the k9s command launches a TUI showing the pod resources in the default namespace, using the default context as the connection information.
When we have multiple contexts configured, we can launch k9s on a specific context using the –context argument:
$ k9s --context devThe command above launches k9s pointing to the dev cluster.
Besides that, we can change the resources and namespace that we’ll see after the TUI launch using the -c and -n arguments, respectively:
$ k9s -n app -c servicesAfter running the command above, we start k9s with the terminal UI showing the service resources in the app namespace.
Critically, we can start the k9s TUI in read-only mode using the –readonly flag:
$ k9s --readonlyThis option can be helpful when we want to prevent accidental modification to the cluster resources.
When we launch the k9s command, the TUI will fill up the entire terminal pane displaying various information:
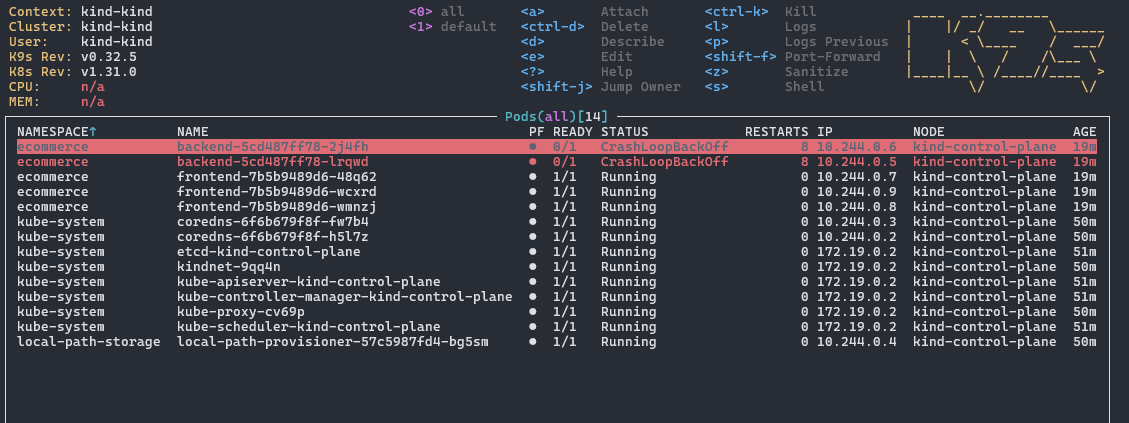
The TUI can be grouped into two distinct regions. First, the header region displays diagnostic and help information:

In the top left corner, the tool displays various cluster information. Specifically, it shows the name of the context, cluster, and the user we’re accessing the cluster as. Besides that, it shows the versions of k9s and Kubernetes cluster.
On the other hand, we can see a list of commonly used keybindings in the top right corner of the header pane. For example, the keybinding ctrl-d deletes resources.
Right below the header, we can see the second region that serves as the main display:
Within the main pane, the name of the resource we’re viewing is displayed in the middle top. The parentheses beside the resource name show us the namespace we’re currently viewing. In the example above, we see the pod resources in all the namespaces.
In the main pane, several columns show different information for each resource. The type of information being shown depends on the resources we’re viewing. For instance, the STATUS column will not show up on the service resource page as there isn’t a status for the service resource.
The navigation in k9s is entirely keyboard-based. In other words, we’ll need to get familiar with the different keybindings for navigating the k9s tool.
As with using other command-line tools, the best thing we can learn first is how to seek help. In the k9s TUI, we can enter the question mark character, ?, on any page to display the help page:
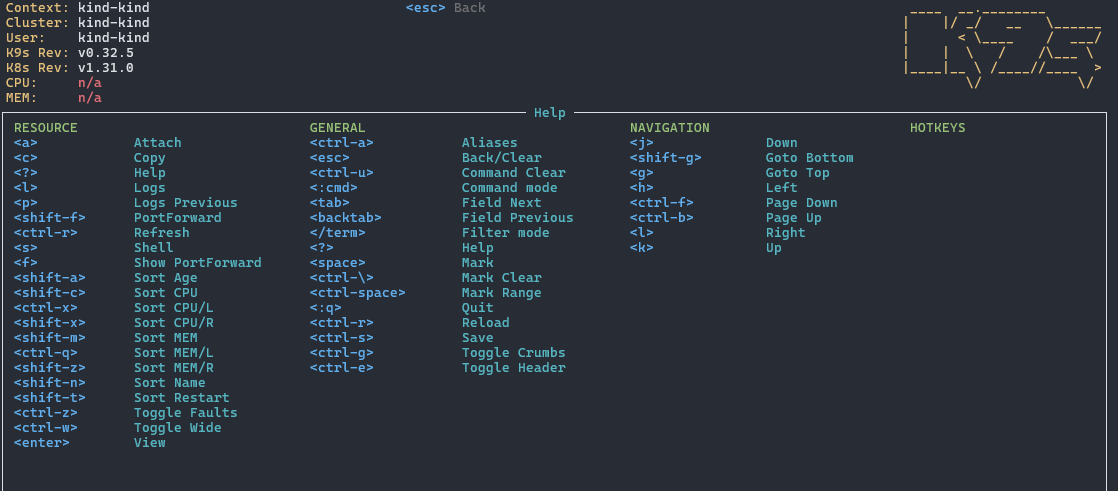
The help page shows all the keybindings we can use to act on the resource we’re currently viewing. The first column shows the keybindings relevant to the resource. Then, the general and navigation columns display the keybindings that are applicable regardless of the resources we’re viewing.
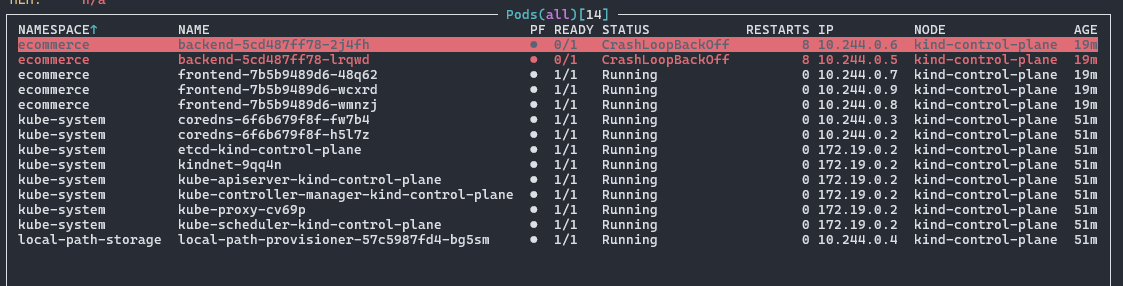
We can filter the content of the main pane using the forward slash character, /. For example, we can enter forward slash followed by the word crashloopback to display a list of pods that are currently in CrashLoopBack status:

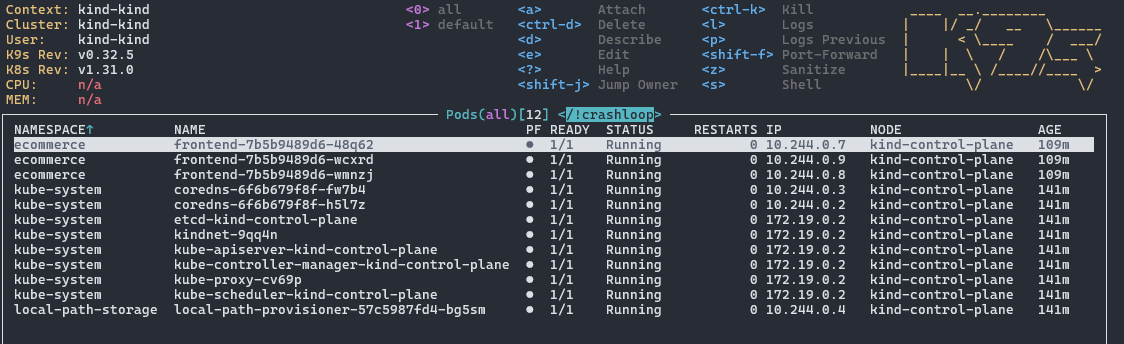
Conversely, we can negate our search result by prefixing the search term with the exclamation mark, !. For instance, we can get a list of pods that are not in CrashLoopBack status using !crashloopback:
Remarkably, the filter function supports fuzzy search if we pass the -f argument to the filter:
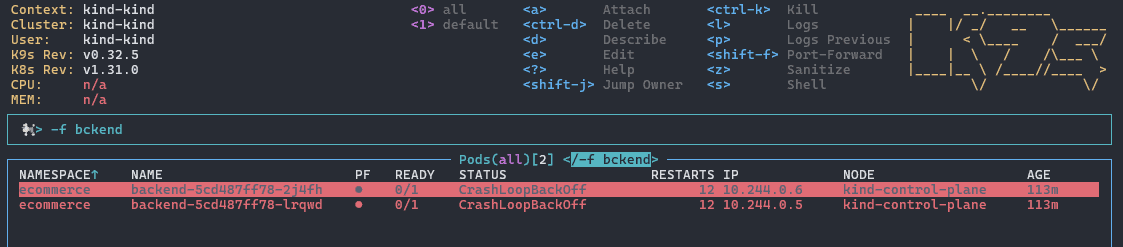
In the example above, the filter returns the backend service pods with the search term omitting the character a.
Finally, we can tap the escape key on our keyboard to exit the filter mode.
The command mode in the k9s TUI is a general entry point to access its features. Specifically, we can use the command mode to navigate different views, such as X-ray and pulse views. Additionally, command mode allows us to navigate between the resources.
To go into command mode, we can enter the colon character: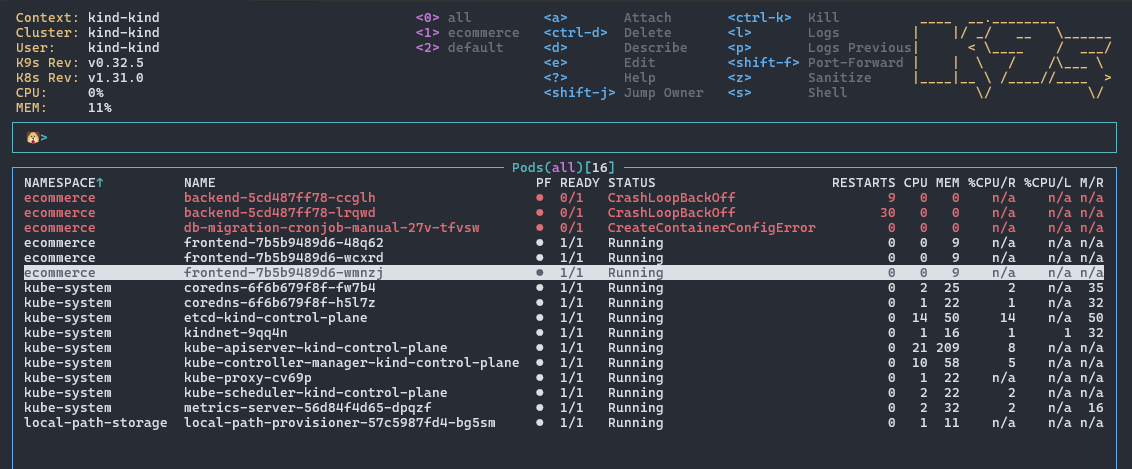
When we’re in command mode, the TUI pops up an additional input box above the main pane. Then, we can enter commands into the box.
In the subsequent sections, we’ll explain the various commands we can use in command mode.
In the k9s TUI, only a single resource is displayed at any time. To change the resources, we can drop into command mode, and then enter the resource name.
For instance, to view the service resources, we press the colon key to enter command mode. Then, we type “service” into the command mode input box:
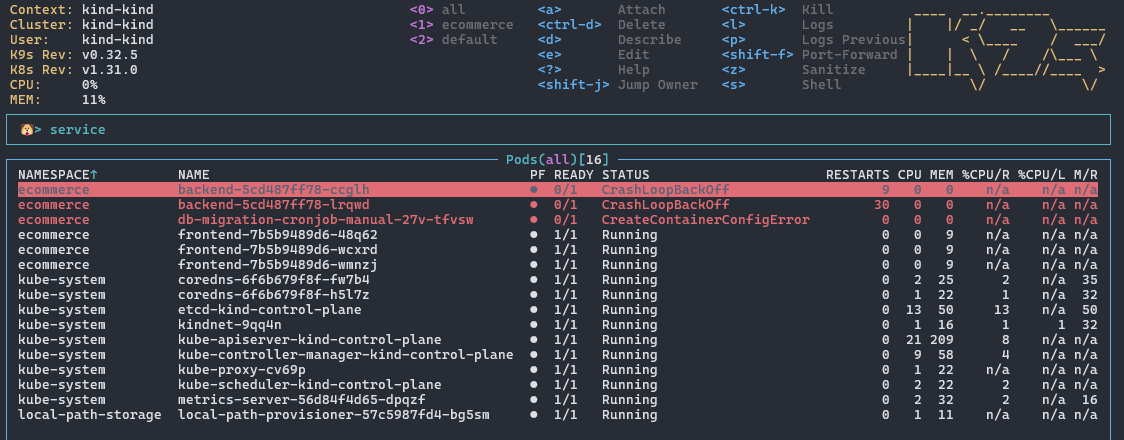
After we press enter, the main pane will change to display the service resources.
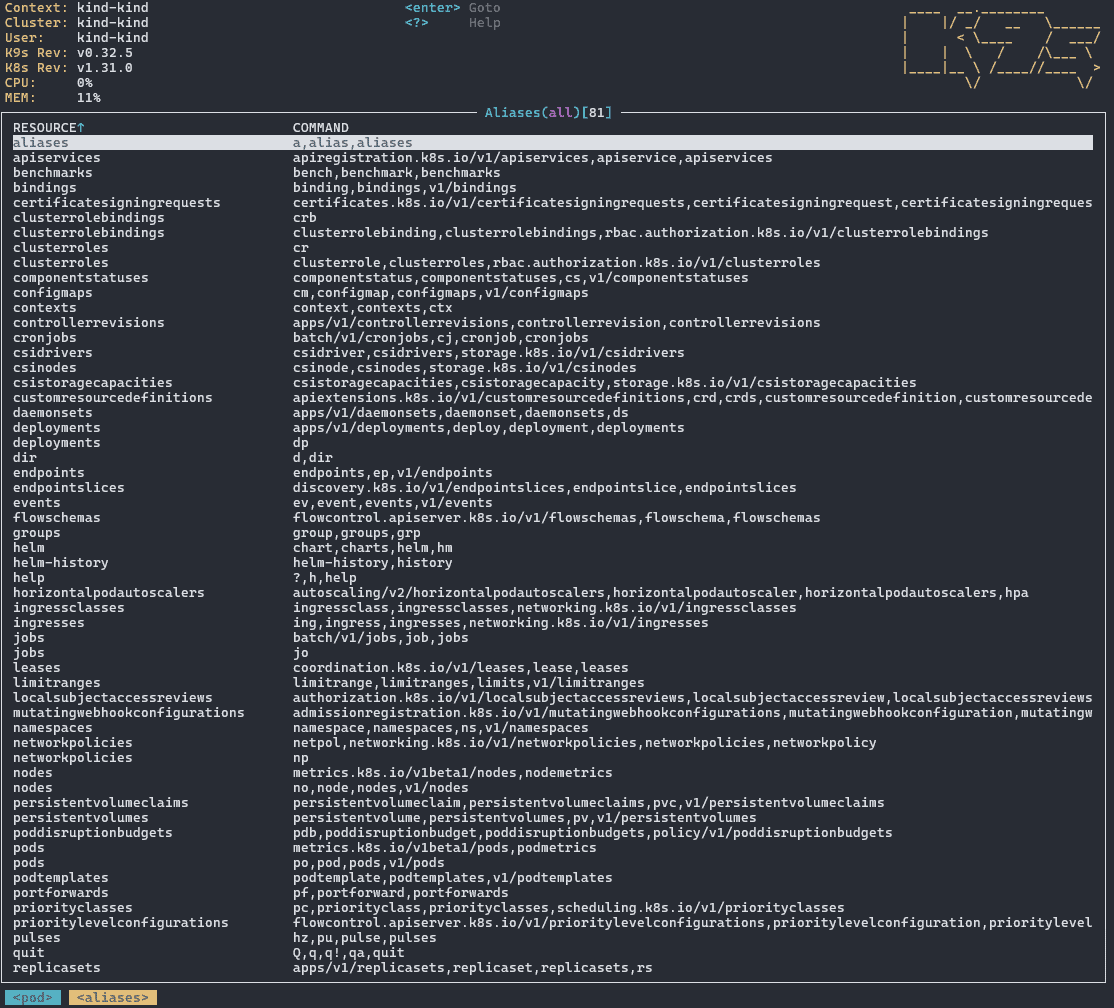
Conveniently, the k9s TUI recognizes the kubectl‘s aliases for resources. Instead of entering the full resource name, we can enter svc to navigate to the service resources.
To see a complete list of resources available, we can use the keybinding ctrl-a:
There are two ways to change the namespace we’re currently viewing. First, we can enter the numbers 0 to 9 corresponding to the different namespaces indicated by the header row. However, this approach is unreliable as not all the namespaces are numbered.
Alternatively, we can navigate to the namespace views by going into command mode and entering ns:
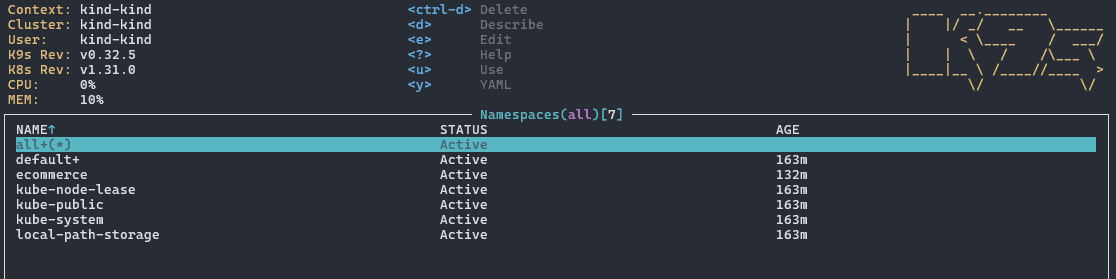
Then, using the arrow keys, we can go to the namespace we want to view and press enter.
To switch the Kubernetes context, we can first list the contexts by entering ctx in the command mode. Then, we use the arrow key to navigate to the contexts we want to switch to and press enter.
The pulse and x-ray views are alternative views of the resources on the cluster. They provide different angles for viewing the state of the clusters on a higher level.
The pulse view shows the real-time metrics and resource usage information for the cluster nodes and pods. Specifically, k9s hooks into the cluster’s metrics server to obtain the cluster state and display them in a graphical representation. The pulse view is excellent for a glance at the overall health of the cluster.
To change to the pulse view, we go into the command mode using a colon character and then enter pulse:
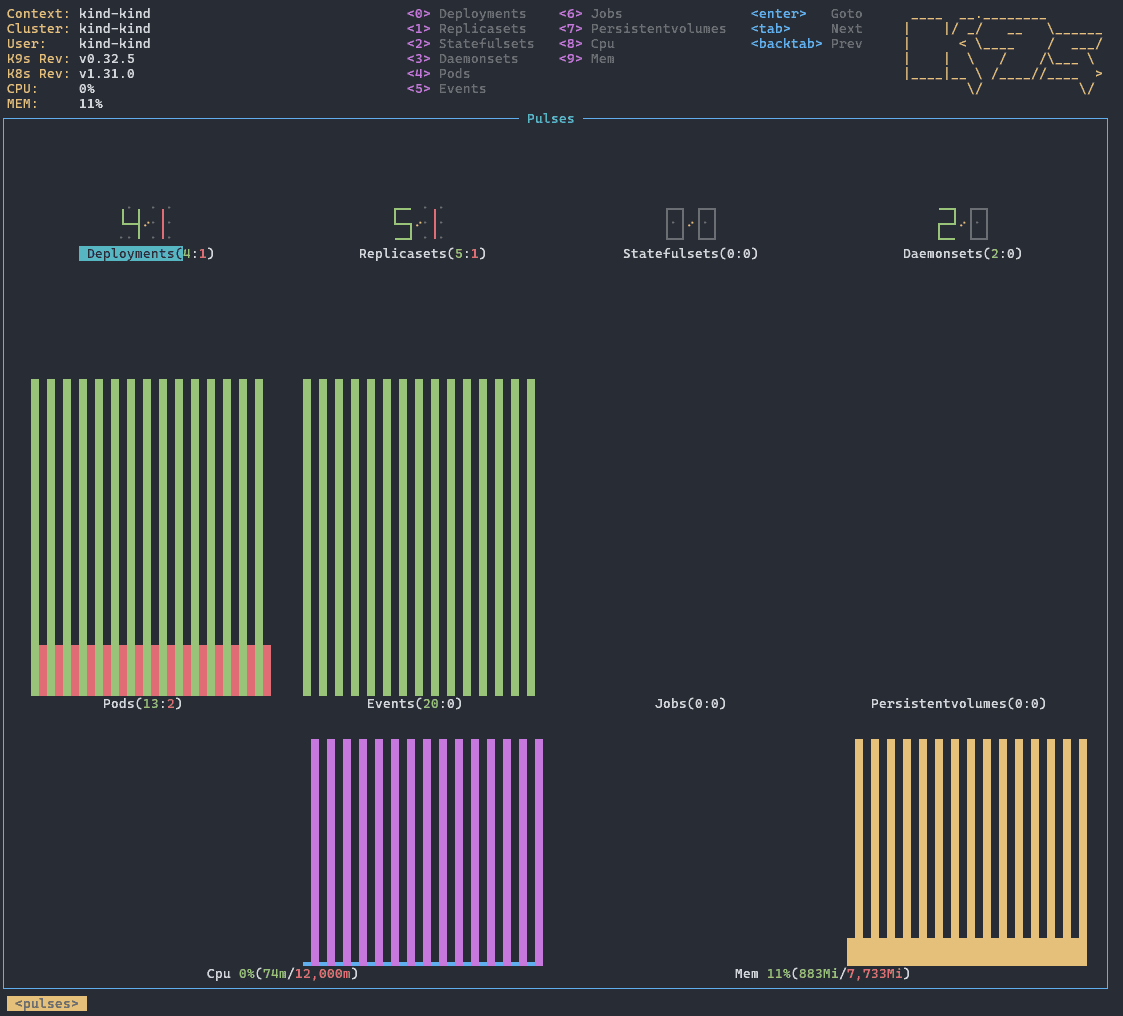
The pulse view displays the number of instances we have for each resource. For example, there are currently five deployments and six replicasets in our Kubernetes resources. Additionally, it breaks down the number of healthy objects and unhealthy objects for each resource.
Finally, it shows the usage and limits of the compute resources, such as the CPU and memory of the entire cluster.
The X-ray view provides a detailed and hierarchical view of a resource. This view helps show an overview of highly hierarchical Kubernetes resources, such as deployments and cronjobs.
To display resources in the X-ray view, we type xray followed by the resource name while in command mode. For example, we can see the hierarchical view of the deployment resources using the X-ray view:
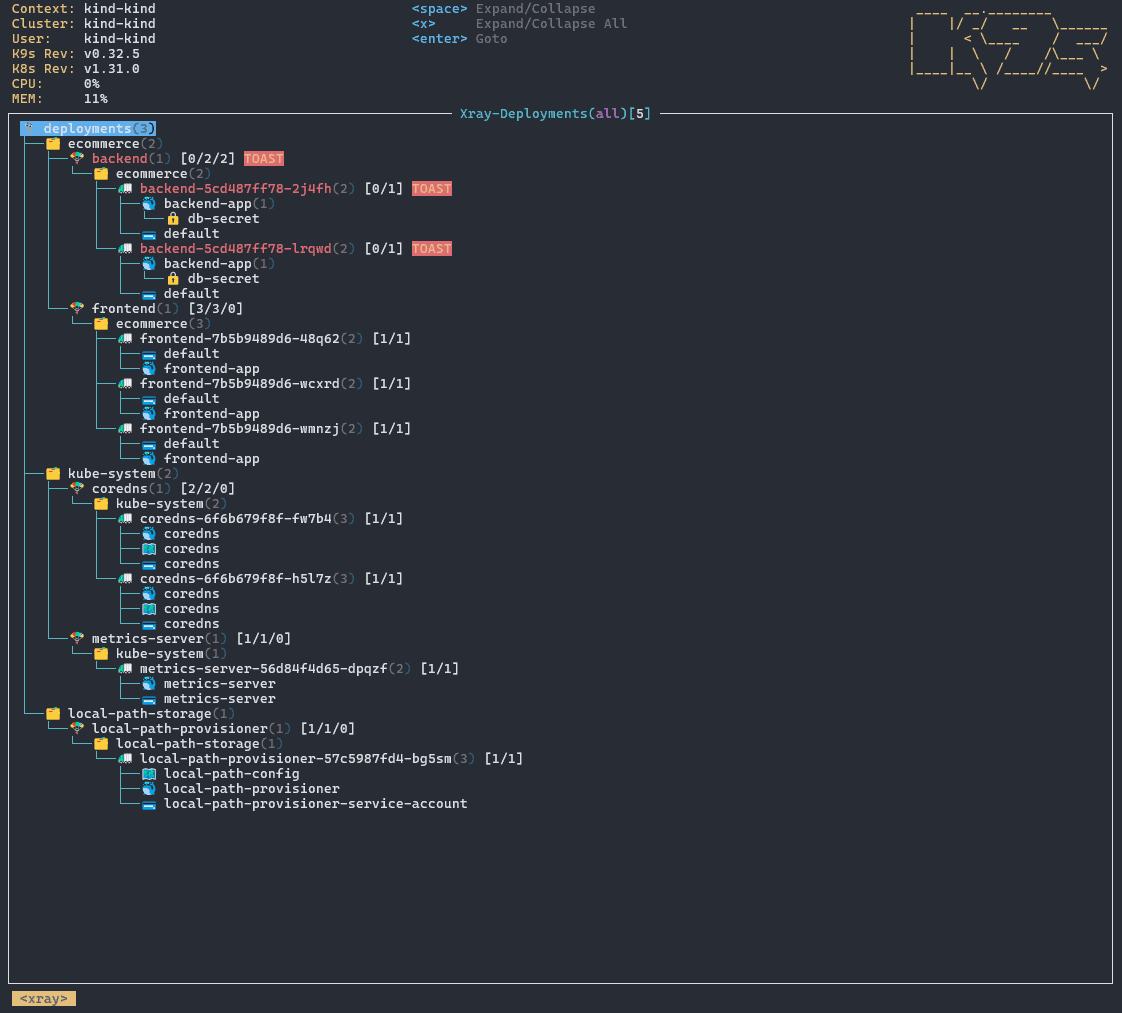
The view lays out all the deployments and their child resources. For instance, we can see that the backend deployment resource spawned the backend-5cd487ff78-2j4fh. Then, the pod contains a backend-app container that depends on the db-secret secret resource.
This section demonstrates several typical usages of k9s for managing a Kubernetes cluster. This can serve as a reference for understanding the possible cluster interactions with the k9s tool.
Within the deployment resource page, we can scale any deployment by pressing the s key:

Then, we can enter the desired number of replicas on the prompt and press enter to update the deployment resource.
To delete resources, we can use the ctrl-d binding. For instance, we can kill a pod by highlighting it and then entering the keybinding:
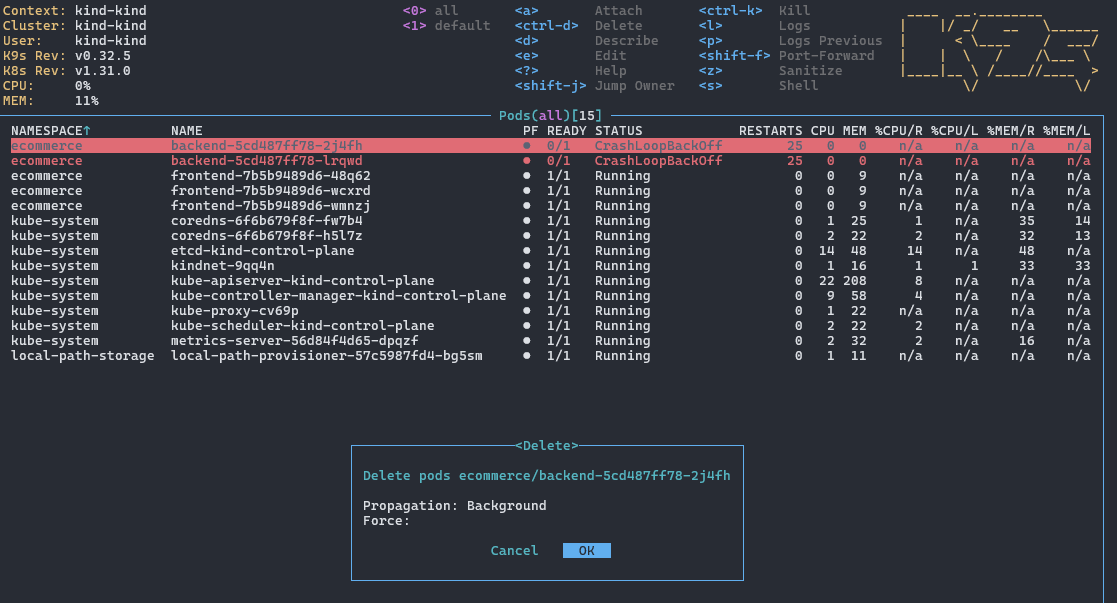
On the dialog, we can enable the force deletion to instantly remove the resource.
A cronjob is typically scheduled to run at a specific time using the cron syntax. Using k9s, we can manually trigger a cronjob by pressing the t key:
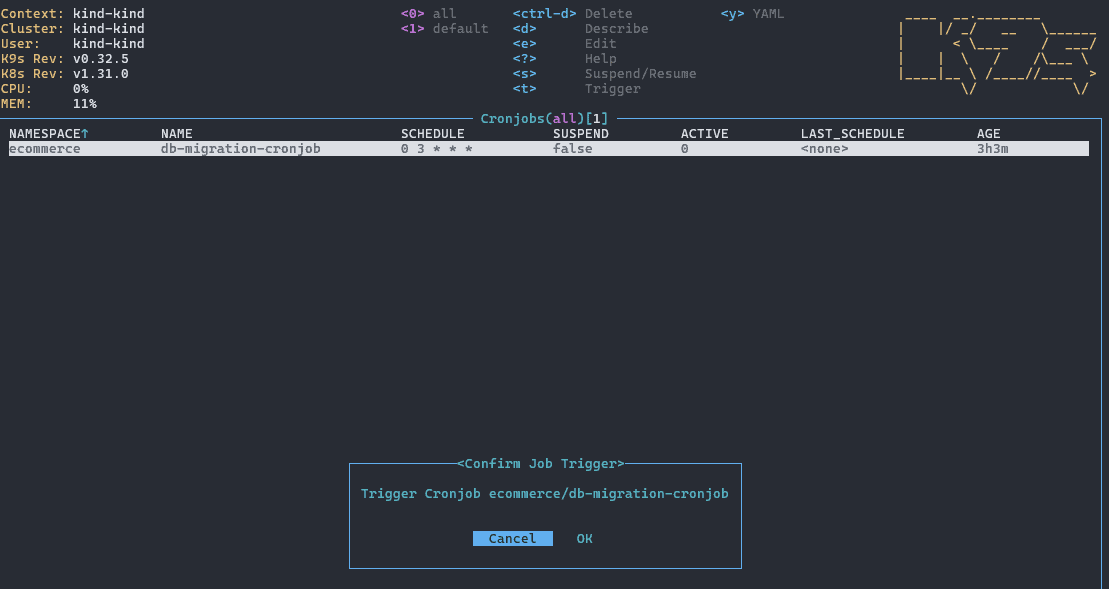
Upon the key press, we’ll be asked for confirmation. We can press the right arrow key to select the Ok button and press enter to trigger the cronjob.
To view the logs on deployment, job, or pod resources, we can press the l key to enter the log screen:

By default, the pane will tail the logs and auto-scroll to the bottom when new log lines are emitted. To suspend the auto-scroll, we can toggle it off using the s key.
Additionally, we can toggle word-wrap using the w key so that longer log lines are wrapped into a new line, depending on the width of the terminal.
Finally, pressing the f key toggles the log window into full screen, which is friendlier for copying and pasting.
In this article, we’ve comprehensively walked through the k9s command, starting from its installation to the different usages for interacting with a Kubernetes cluster.
We also covered different optional arguments we can use to alter its launching behavior. Additionally, we explored the pulse and x-ray modes and explained their usages. Finally, we’ve demonstrated several commonly used commands from the k9s toolset for interacting with the Kubernetes cluster, such as scaling a deployment and deleting a resource with k9s.