

Yes, we're now running our only Summer Sale. All Courses are 30% off until 20th July, 2026:
Configure Jenkins to Run and Show JMeter Tests
Last updated: March 19, 2024
Learn through the super-clean Baeldung Pro experience:
>> Membership and Baeldung Pro.
No ads, dark-mode and 6 months free of IntelliJ Idea Ultimate to start with.
1. Overview
In this article, we’re going to configure a continuous delivery pipeline using Jenkins and Apache JMeter.
We’ll rely on the JMeter article as a great starting-point to first understand the basics of JMeter, as it already has some configured performance tests we can run. And, we’ll use the build output of that project to see the report generated by the Jenkins Performance plugin.
2. Setting up Jenkins
First of all, we need to download the latest stable version of Jenkins, navigate to the folder where our file is and run it using the java -jar jenkins.war command.
Keep in mind that we can’t use Jenkins without an initial users setup.
3. Installing the Performance Plugin
Let’s install the Performance plugin, which is necessary for running and displaying JMeter tests:
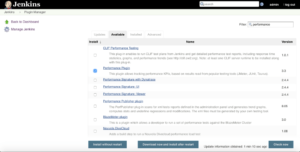
Now, we need to remember to restart the instance.
4. Run JMeter Tests With Jenkins
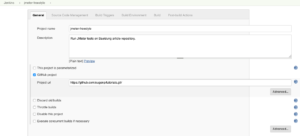
Now, let’s go to Jenkins home page and click on “create new jobs”, specify a name, select Freestyle project and click “OK”.
In the next step, on the General Tab, we can configure it with these general details:
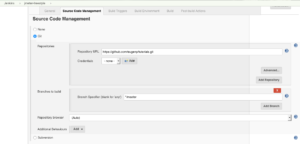
Next, let’s set the repository URL and branches to build:
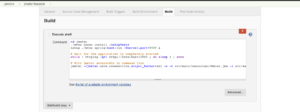
Now go to the Build Tab to specify how we’ll build the project. Here instead of directly specified the Maven command to build the whole project, we can take another way to better have the control of our pipeline as the intent is just to build one module.
On the Execute shell Sub-tab we write a script to perform the necessary actions after the repository is cloned:
- Navigate to the desired sub-module
- We compiled it
- We deployed it, knowing that it’s a spring-boot based project
- We wait until the app is available on the port 8989
- And at the end, we just specify both the path of our JMeter script (located inside the resource folder of the jmeter module) to use for performance testing and the path of the resultant file (JMeter.jtl) also in the resource folder
Here is the small corresponding shell script:
cd jmeter
./mvnw clean install -DskipTests
nohup ./mvnw spring-boot:run -Dserver.port=8989 &

while ! httping -qc1 http://localhost:8989 ; do sleep 1 ; done

jmeter -Jjmeter.save.saveservice.output_format=xml
  -n -t src/main/resources/JMeter.jmx
    -l src/main/resources/JMeter.jtl
As shown in the following image:
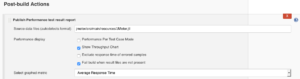
After the project is cloned from GitHub, we compiled it, opened on port 8989 and processed the performance tests, we need to make the performance plugin display result in a user-friendly way.
We can do that by adding a dedicated Post-build Actions. We need to provide the results source file and configure the action:
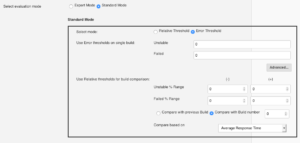
We choose the Standard Mode with the subsequent configs:
Let’s hit Save, on the left menu of Jenkins dashboard click on the button Build Now and wait for it to finish the set of operations we configured up there.
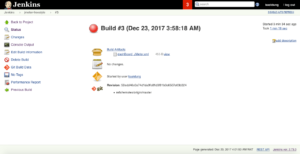
After it’s finished, we’ll see on the console all outputs of our project. At the end we’ll get either Finished: SUCCESS or Finished: FAILURE:
Let’s go to the Performance Report area accessible via the left side menu.
Here we’ll have the report of all past builds including the current one to see the difference in term of performance:
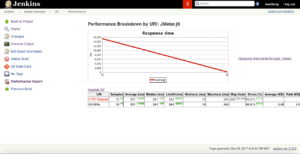
Let’s click on the indication just up of the table to have only the result of the last build we just made:
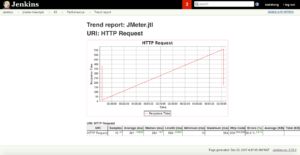
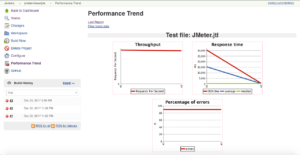
From the dashboard of our project we can get the Performance Trend, which are other graphs showing the last builds results:
Note: Applying the same thing to a Pipeline project is also simple as:
- Create another project (item) from the dashboard and name it JMeter-pipeline for example (General info Tab)
- Select Pipeline as project type
- On the Pipeline Tab, on the definition select Pipeline script and check Use Groovy Sandbox
- In the script area just fill the following lines:
node {
    stage 'Build, Test and Package'
    git 'https://github.com/eugenp/tutorials.git'

    dir('jmeter') {
        sh "./mvnw clean install -DskipTests"
        sh 'nohup ./mvnw spring-boot:run -Dserver.port=8989 &'
        sh "while ! httping -qc1
          http://localhost:8989 ; do sleep 1 ; done"

        sh "jmeter -Jjmeter.save.saveservice.output_format=xml
          -n -t src/main/resources/JMeter.jmx
            -l src/main/resources/JMeter.jtl"
        step([$class: 'ArtifactArchiver', artifacts: 'JMeter.jtl'])
        sh "pid=\$(lsof -i:8989 -t); kill -TERM \$pid || kill -KILL \$pid"
    }
}
This script starts by cloning the project, goes in the target module, compile and run it to make sure the app is accessible at http://localhost:8989
Next, we run JMeter tests located in the resource folder, save the results as the build output, and finally, the application is closed.
5. Conclusion
In this quick article, we have settled up a simple continuous delivery environment to run and show Apache JMeter tests in Jenkins in two ways; first via a Freestyle project and second with a Pipeline.
As always, the source code for this article can be found over on GitHub.