

Yes, we're now running our only Summer Sale. All Courses are 30% off until 20th July, 2026:
Learn through the super-clean Baeldung Pro experience:
>> Membership and Baeldung Pro.
No ads, dark-mode and 6 months free of IntelliJ Idea Ultimate to start with.
1. Overview
Apache Kafka is a powerful distributed event-streaming platform for building real-time data pipelines and streaming applications. To interact with the cluster, Apache Kafka comes with CLI shell scripts such as kafka-topics.sh, for any commands related to interacting with topics. Alternatively, some GUI-based tools make interacting with the Kafka cluster more intuitive and straightforward in graphical environments. One such tool is Kafdrop.
In this tutorial, we’ll explore how to use Kafdrop as the frontend UI to manage and monitor Kafka brokers effectively.
2. Kafdrop Deployment
Kafdrop is a program that serves a web UI interface that enables us to interact with a Kafka cluster. Moreover, Kafdrop is open source and is built with the Spring Boot framework in Java. It supports connecting to a basic Kafka cluster or secured brokers behind TLS and SASL. Additionally, it supports connecting to a schema registry for serializing and deserializing messages backed by schemas like AVRO.
There are various ways we can install and run Kafdrop on a system. Concretely, we can run the program in different ways:
- directly as a JAR file
- as a Docker container
- as a managed Kubernetes workload with the help of the helm command
For demonstration purposes, we focus on the way to run Kafdrop as a Docker container.
2.1. Running Kafdrop as a Docker Container
The kafdrop Docker image is hosted on DockerHub under the path obsidiandynamics/kafdrop. To run the container, we can use the docker run command:
$ docker run -d --rm -p 9000:9000 \
    -e KAFKA_BROKERCONNECT=localhost:9092 \
    obsidiandynamics/kafdrop
Here, we use the minimal options required to start the Kafdrop container. Importantly, we must point to the Kafka brokers we want to connect to by passing the server address and port value to the KAFKA_BROKERCONNECT environment variable.
2.2. Environment Variable Configuration
In addition to the required KAFKA_BROKERCONNECT, the kafdrop Docker image supports configuration via other environment variables:
$ docker run -d --rm -p 9000:9000 \
    -e KAFKA_BROKERCONNECT=host:port,host:port \
    -e JVM_OPTS="-Xms32M -Xmx64M" \
    -e SERVER_PORT=9000 \
    -e SERVER_SERVLET_CONTEXTPATH="/kafka-ui" \
    obsidiandynamics/kafdrop
Specifically, we set several options:
- JVM_OPTS adds JVM-related configuration
- SERVER_PORT controls the port that the server uses
- SERVER_SERVLET_CONTEXTPATH can configure the context path exposed through the web UI
In the example above, we can access Kafdrop by visiting http://localhost:9000/kafka-ui in the browser.
2.3. Passing Additional Kafdrop Configurations
Kafdrop supports many more configuration options than those exposed through the environment variables. For example, the –schemaregistry.connect property configures the host address and port for the schema registry.
To pass properties that aren’t exposed in the environment variables, we can use the CMD_ARGS environment variable:
$ docker run -d --rm -p 9000:9000 \
    -e KAFKA_BROKERCONNECT=localhost:9092 \
    -e SERVER_SERVLET_CONTEXTPATH="/" \
    -e CMD_ARGS="--schemaregistry.connect=localhost:8001 --schemaregistry.auth=adminuser:adminpassword" \
    obsidiandynamics/kafdrop
The configuration above starts Kafdrop and configures the server to connect to the schema registry at localhost:8001. Additionally, we specified the credentials for the schema registry connection using the –schemaregistry.auth property.
3. Basic Usage
At this point, the web UI home page should be at http://localhost:9000. On the home page, Kafdrop presents various high-level information about the Kafka cluster:
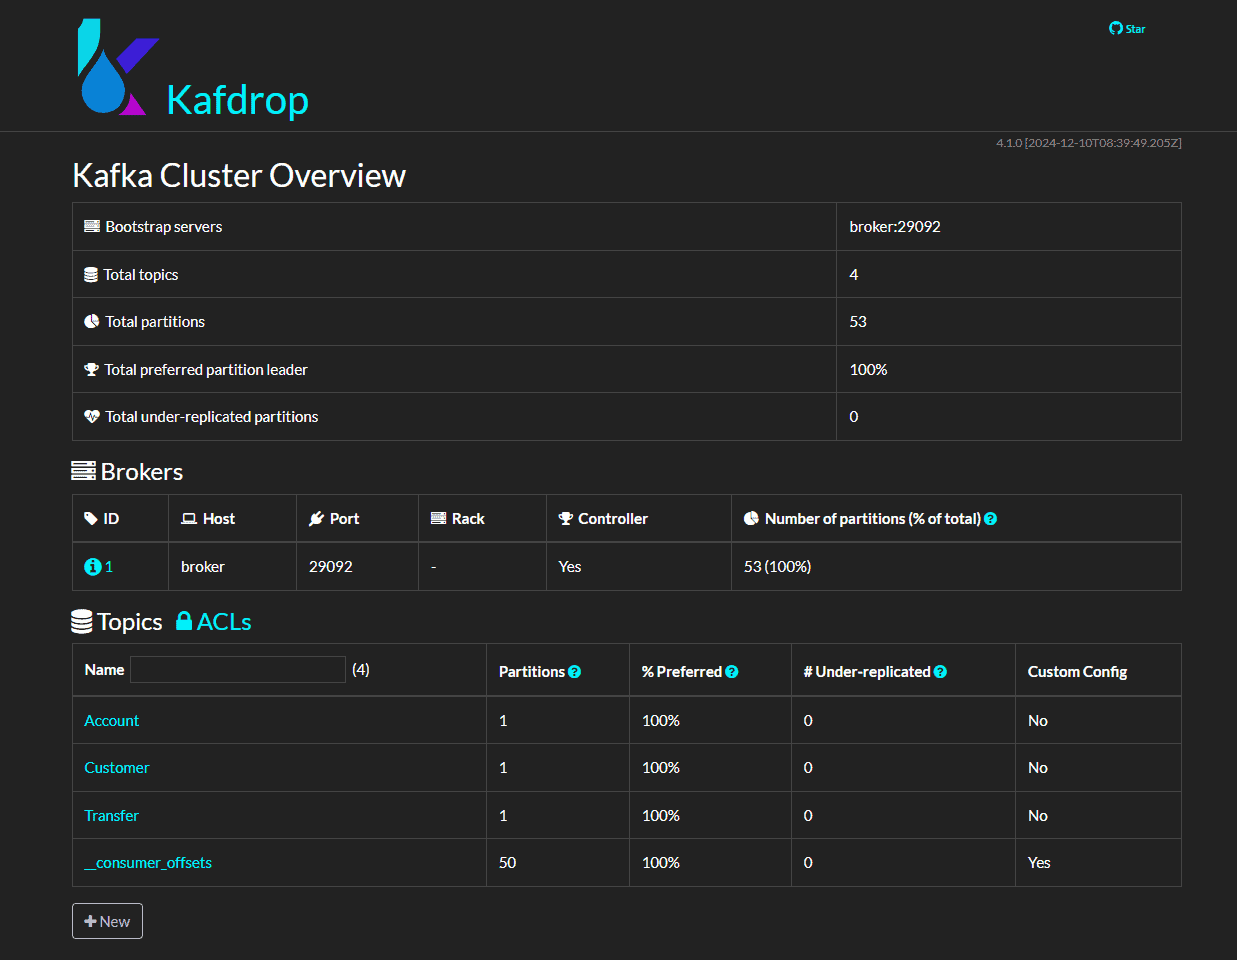
To begin with, an overview of the Kafka cluster at the top shows summaries like the total number of topics, total partitions, and the bootstrap servers.
Then, the Brokers table shows a list of brokers in the cluster. For each broker, we see a column that shows basic information such as host, port, and the number of partitions hosted on the broker. Importantly, there’s a Controller column indicating whether a broker is a controller broker in the cluster.
In the bottom section, the Topics table shows a list of the topics currently in the cluster. Furthermore, the New button below the table enables us to create a new topic.
From this page, we can navigate to the broker detail page by pressing on the broker ID value present in the table. Alternatively, we can check out the details of the topic by pressing on the topic name in the Topics table.
3.1. Broker Detail
In the broker detail page, we can see details specific to that broker:
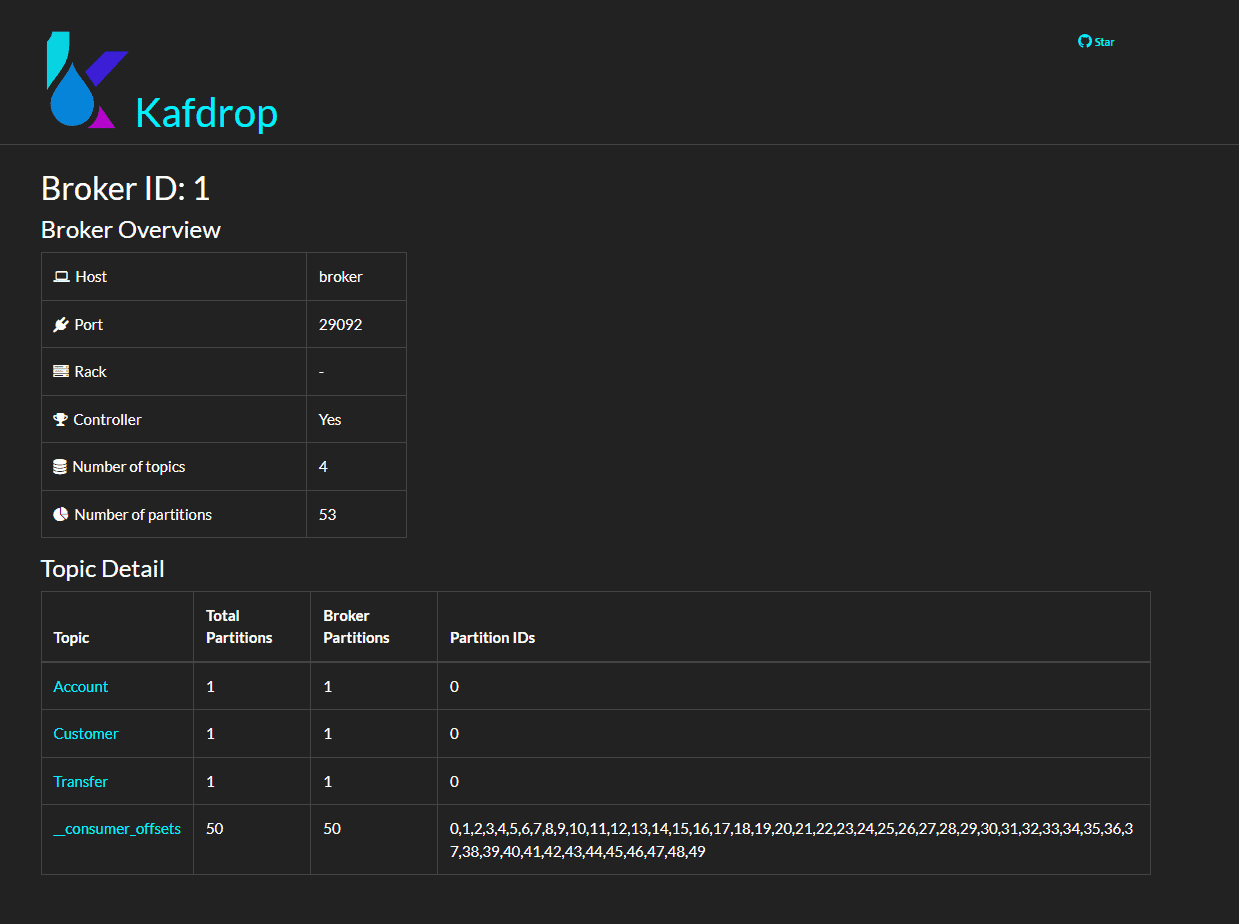
For instance, we can see that this broker is hosting four topics and 53 partitions for the cluster.
Additionally, the table at the bottom of the page shows the topics in the cluster that are hosted by this broker:
In a multi-broker cluster setup, the partitions of the different topics are distributed among the separate brokers. In such a setup, this page helps us identify which topic partitions reside in the given broker.
4. Topic Details
On the topic detail page, we can see more information specific to the currently selected topic:
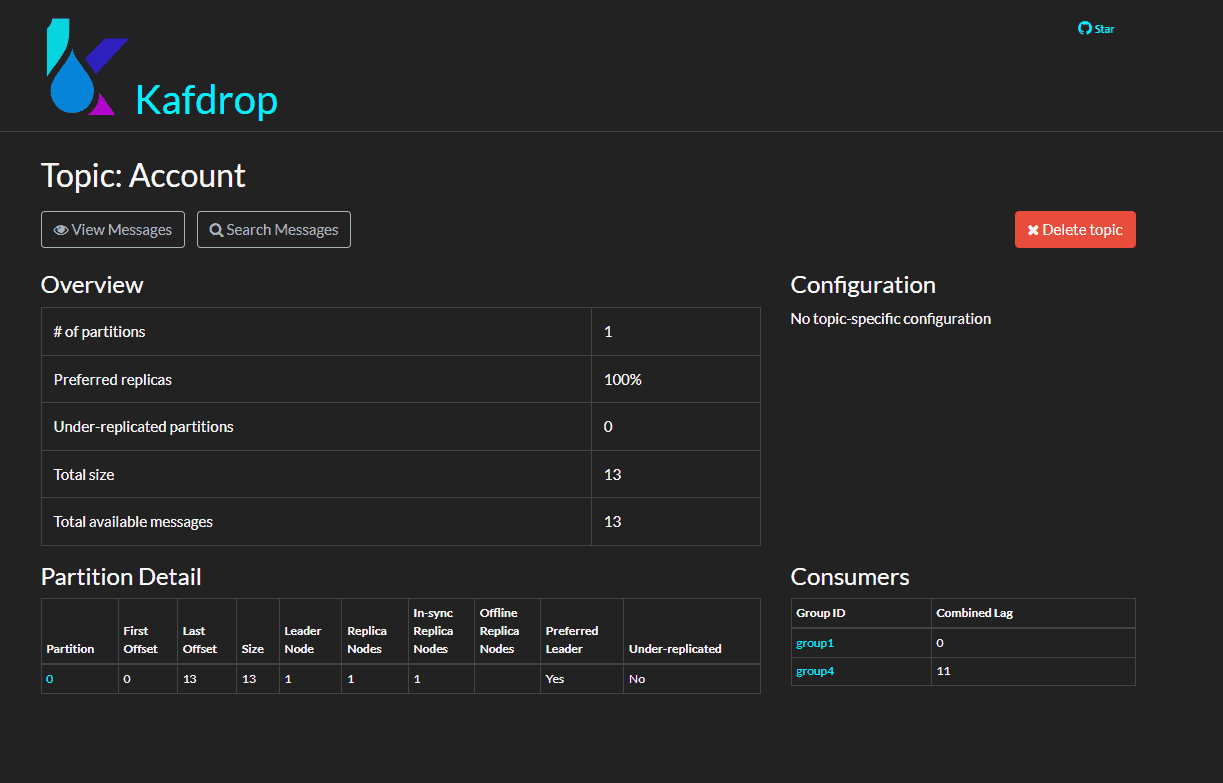
Data such as the total number of messages, number of partitions, and the consumer groups for the topic is presented in tabular format. Additionally, the page also contains the Delete topic button, which provides a way to delete the topic from the Kafka cluster.
Separately, the Consumers table on the right-hand side shows that there are currently two consumer groups using the topic: group1 and group4. From the table, we can see that group1 has zero lag, indicating that it has already caught up with all the messages in the topic. On the other hand, the group4 consumer group has a lag value of 11, meaning that it’s lagging by 11 messages.
To browse the messages in the topic, we can use either the View Messages or Search Messages button.
4.1. View Messages
The View Messages button brings us to the messages page of the topic. The messages page offers a simple UI for browsing messages in the topic with optional offset or partition filtering. Upon pressing the View Messages or Search button, messages are displayed in a row-by-row view, ordered by their offset in ascending order:
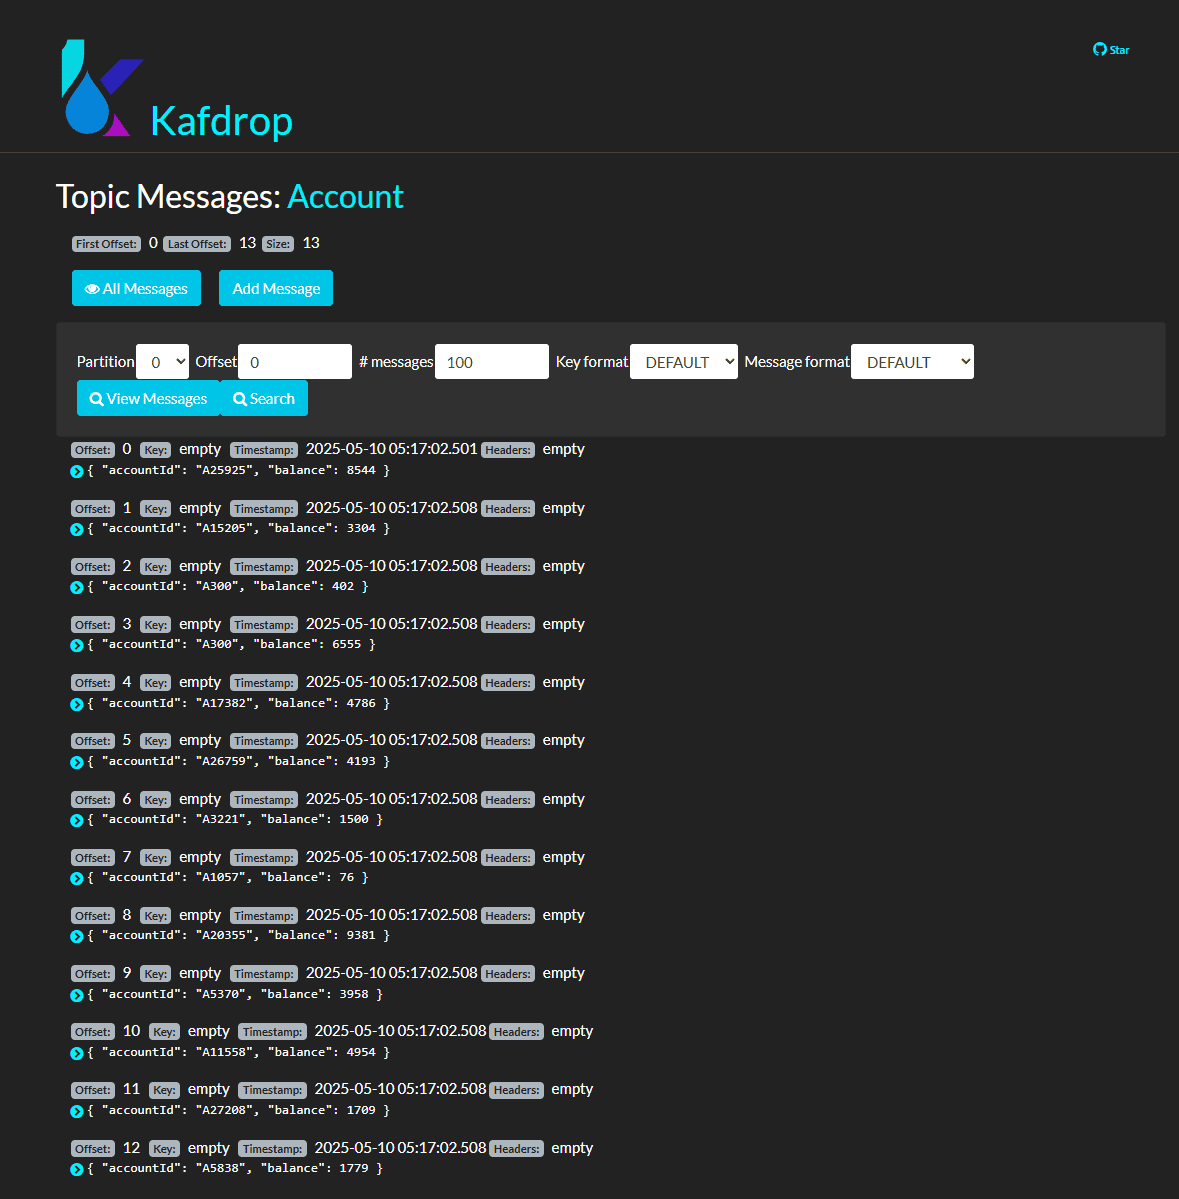
Additionally, pressing the Add Message button brings up a dialog that enables us to publish a message to the topic. We can put in the key and value of the message and press Send to publish the message to the broker.
4.2. Search Messages
The search message page offers an additional Search Text field to return messages in the topic if they contain a string we specify.
For example, let’s find messages in the Account topic that contain the substring A1:
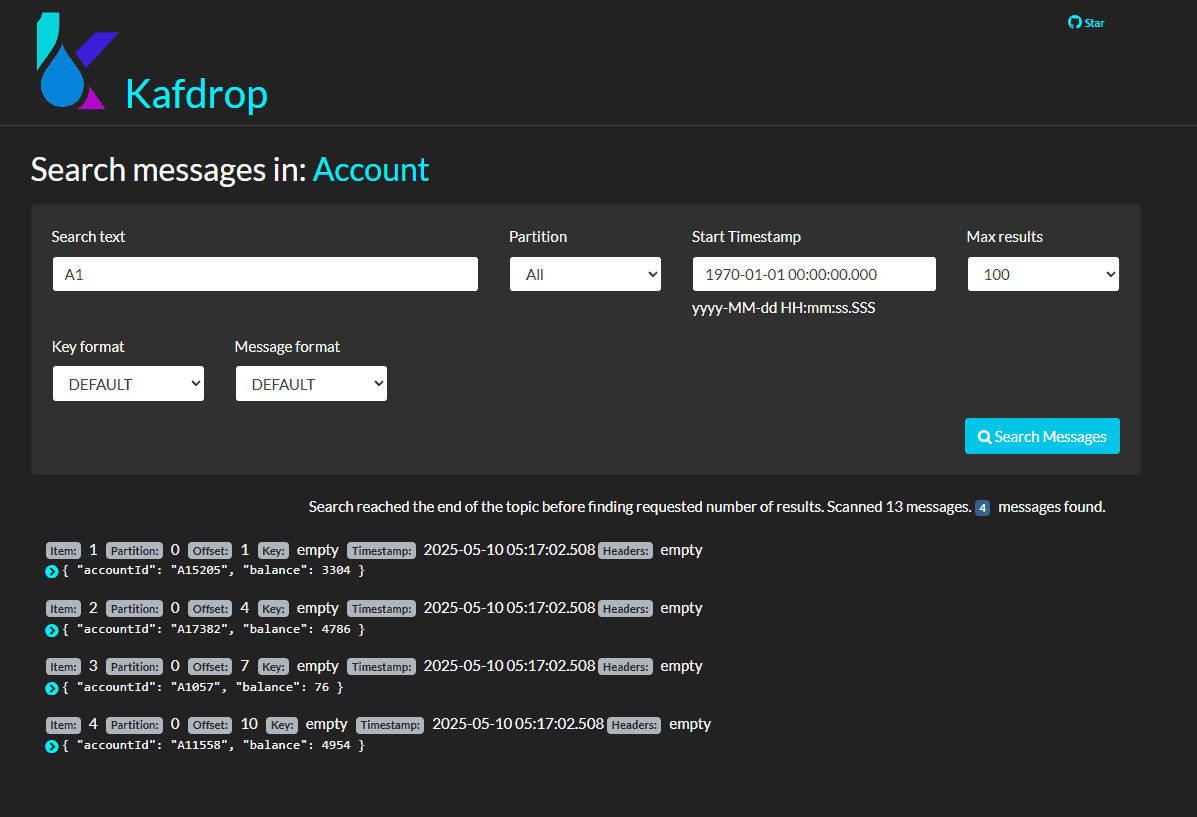
We can see that the result shows the messages in that topic that contain the text in the Search Text input.
5. Conclusion
In this article, we learned that Kafdrop offers a web UI for managing and browsing Kafka brokers. Additionally, we demonstrated how we can start the Kafdrop web UI as a Docker container. Importantly, we showed how to configure Kafdrop using various environment variables offered by the tool.
Then, we learned about the basic usage of the Kafdrop web UI. For example, Kafdrop shows the broker details in the cluster. Additionally, we can inspect the details of the topics and consumer groups in the topic detail page. Finally, the message view and search pages enable the inspection and filtering of messages in a topic that match a certain substring.