


Learn through the super-clean Baeldung Pro experience:
>> Membership and Baeldung Pro.
No ads, dark-mode and 6 months free of IntelliJ Idea Ultimate to start with.
Learn through the super-clean Baeldung Pro experience:
>> Membership and Baeldung Pro.
No ads, dark-mode and 6 months free of IntelliJ Idea Ultimate to start with.
In this tutorial, we’re going to illustrate how to keep an application deployed within OpenShift healthy.
First, let’s try to understand what it means to keep an application healthy.
Very often, applications within pods experience problems. In particular, the application may stop responding or start responding incorrectly.
An application may become unhealthy due to temporary problems, such as configuration errors or connectivity to external components like databases, storage, or other applications.
The first step in building a resilient application is to implement automatic health checks on the pods. In the event of a problem, the pods will be restarted automatically, without manual intervention.
Kubernetes and, therefore, OpenShift, offers two types of probes: liveness probes and readiness probes.
We use liveness probes to know when it’s necessary to restart a container. OpenShift restarts the pod when the health check fails and the pod becomes unavailable.
Readiness probes verify the availability of a container to accept traffic. We consider a pod ready when all its containers are ready. The service load balancers remove the pod when this isn’t in the ready state.
In case a container takes a long time to start, the mechanism allows us to route connections to the pods that are ready to accept the required traffic. This can occur, for example, when there’s a need to initialize a dataset or establish a connection to another container or an external service.
We can configure the liveness probe in two ways:
In both cases, the result obtained remains the same. The first mechanism is inherited directly from Kubernetes, already discussed in another tutorial.
In this tutorial, instead, we show how to configure the probes using the OpenShift graphical user interface.
We define a liveness probe as a parameter for specific containers within the deployment configuration file. All the containers inside the pod will inherit this configuration.
In case the probe has been created as an HTTP or TCP check, the probe will be executed from the node the container is running on. OpenShift executes the probe inside the container when the probe is created as a script.
So, let’s add a new liveness probe to an application deployed within OpenShift:

Let’s break down what each of these Liveness Probe settings means:
OpenShift creates a new DeploymentConfig for the application. The new DeploymentConfig will contain the definition of the newly configured probe.
We can configure readiness probes to ensure that the container is ready to receive traffic before it is considered active. Unlike the liveness probe, if a container fails the readiness check, that container remains active but is unable to serve traffic.
The readiness probe is essential to perform zero-downtime deployments.
As in the case of the liveness probe, we can configure the readiness probe using the OpenShift wizard, or by directly editing the pod deployment file.
Since we’ve already configured the liveness probe, let’s now configure the readiness probe:

As seen for the liveness probe, the configurable parameters are as follows:
Again, OpenShift creates a new DeploymentConfig – containing the readiness probe – for our application.
It’s time to test what we’ve presented. Suppose we have a Spring Boot application to deploy within an OpenShift cluster. To do this, we can refer to our tutorial, where the test application is presented as a step-by-step deployment.
Once the application has been correctly deployed, we can start by setting up the probes, following what presented in the previous paragraphs. The Spring Boot application uses Spring Boot Actuator to expose the health check endpoints. We can find more information about configuring the Actuator in our dedicated tutorial.
At the end of the setup, the Deployment configuration page will show the information about the newly configured probes:
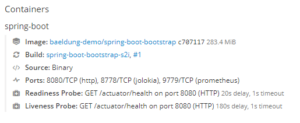
Now it’s time to check that the readiness and liveness probes are working properly.
Let’s try to simulate the deployment of a new version of the application. The readiness probe allows us to deploy with zero downtime. In this case, when we deploy a new version, OpenShift will create a new pod corresponding to the new version. The old pod will continue to serve traffic until the new pod is ready to receive traffic — that is until the readiness probe of the new pod returns a positive result.
From the OpenShift dashboard, inside the page of our project, if we look in the middle of the deployment phase, we can see the representation of the zero-downtime deploy:

Let’s simulate the failure of the liveness probe instead.
Let’s suppose that the health check performed by the application at this point will return a negative result. This indicates the unavailability of a resource necessary for the work of the pod.
OpenShift will kill the pod n times (by default, n is set to 3) and recreate it. If the problems are solved during this phase, the pod is restored to its state of health. Otherwise, OpenShift considers the pod in Failed status if dependent resources continue to be unavailable during the attempts.
Let’s verify this behavior. Let’s open the page containing the list of events related to the pod. We should view a screen similar to the following one:

As we can see, OpenShift recorded the health check failure, killed the pod, and tried to restart it.
In this tutorial, we explored OpenShift’s two types of probes.
We used readiness and liveness probes in parallel in the same container. We used both of them to ensure that OpenShift restarts the containers when there are problems and doesn’t allow traffic to reach them when they’re not yet ready to serve. The complete source code of our examples here is, as always, over on GitHub.