

Learn through the super-clean Baeldung Pro experience:
>> Membership and Baeldung Pro.
No ads, dark-mode and 6 months free of IntelliJ Idea Ultimate to start with.
Learn through the super-clean Baeldung Pro experience:
>> Membership and Baeldung Pro.
No ads, dark-mode and 6 months free of IntelliJ Idea Ultimate to start with.
In this article, we’ll be looking at different tools for monitoring network usage in Linux. Particularly, we’ll explore the following network monitoring tools:
There are a plethora of tools that we can use for monitoring network usage in Linux. We can loosely categorize these tools by how detail they display the network usage in a system.
On the one hand, there are tools that report the network usage per interface as a single figure. They simply sum up all the network traffic in the network interface.
On the other hand, there are tools that groups the network usage on a per-socket or per-process basis. They group different network traffic into their respective socket or process ID. Hence, this provides a finer detail on network bandwidth consumption.
Let’s take a look at these tools in Linux and how they can be used.
nload is a command-line tool that displays the network usage on the system. It belongs to the category of network monitoring tool in Linux that simply sum up all the network traffic on a network interface.
For Debian based Linux, we can install it using apt-get:
$ apt-get install -y nloadOn the other hand, we’ll use yum for RHEL based Linux:
$ yum install -y epel-release
$ yum install -y nloadIn the simplest form, nload can be invoked without any arguments:
$ nloadThe command launches an interactive screen:
Device eth0 [172.17.0.2] (1/4):
============================================================Incoming:


                                          Curr: 1.09 kBit/s
                                          Avg: 760.00 Bit/s
                                          Min: 0.00 Bit/s
                                          Max: 1.09 kBit/s
                                          Ttl: 16.98 MByte
Outgoing:


                                          Curr: 1.09 kBit/s
                                          Avg: 760.00 Bit/s
                                          Min: 0.00 Bit/s
                                          Max: 1.09 kBit/s
                                          Ttl: 361.65 kByte
On the top of the display is the device we’re currently monitoring. Using the arrow keys left and right, we can cycle between the different network interfaces available in the system.
The rest of the screen shows the network usage for incoming and outgoing network traffic. Additionally, it provides a basic statistical figure such as average, minimum, and maximum figure.
By default, the network usage is updated once every 500 milliseconds. To change the refresh interval, we can pass the flag -t followed by an integer value in milliseconds.
For example, to refresh once every 2000 milliseconds:
$ nload -t 2000The resulting screen will be updated once every 2 seconds.
To change the unit on the network traffic rate, we can use the flag -u:
$ nload -u mThe command above runs the nload program and displays the network traffic rate in terms of megabits per second.
The flag -u accepts the following values:
Additionally, we can change the unit of the total amount of data transferred using the flag -U. This flag also accepts similar values to the flag -u.
We can make nload display all the network interfaces in a single screen using the flag -m.
$ nload -mIn this mode, we can look at the network usage for all the interfaces in one single screen. However, the graphs for the network traffic will not be displayed.
speedometer is a network monitoring tool. Similar to nload, it doesn’t differentiate the network traffic on a network interface by socket or processes.
However, one thing that separates it from netload is that the display of speedometer is much more customizable.
On Debian based Linux, we’ll use apt-get to install speedometer:
$ apt-get install -y speedometerUnfortunately, speedometer is unavailable in yum package manager.
Let’s monitor the outgoing network traffic rate for our network interface eth0:
$ speedometer -t eth0
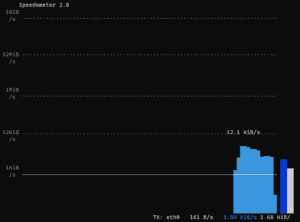
Running the command results in a graph showing up on the console output. Additionally, this graph is being constantly updated by the speedometer instance that is monitoring the interface eth0.
Then, we can see additional information at the bottom of the graph.
Starting from the left, the label TX: eth0 indicates that this is the graph for the transmission rate for the network interface eth0. Then, there are 3 numbers to the right of the label.
The first number represents the last sampled rate. Next, the second number represents a weighted average of the last 6 samples. The weights are such that the latest number has more weight than the older rate.
Finally, the 3rd number is a simple average of all past data points.
We can display multiple graphs side by side using the flag -c. For example, we can display the receiving rate for interfaces eth0 and lo side by side:
$ speedometer -r eth0 -c -r loThe flag -c serves as a delimiter that divides different graph definition. As we can see from the command, following the flag -c is the argument -r lo. That combination of flag defines a receiving traffic rate for interface lo.
Once executed, we can see 2 graphs lined side by side, reporting the incoming traffic to interfaces eth0 and lo.
iftop is a command-line tool that displays network usage by listening to the interface. In contrast to nload and speedometer, it monitors the network usage on each socket.
To install iftop on Debian based Linux, we’ll use apt-get:
$ apt-get install -y iftopFor RHEL based Linux:
$ yum install -y epel-release
$ yum install -y iftopWe can launch iftop without any argument:
$ iftop
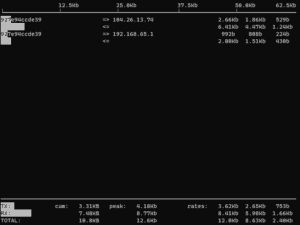
Running iftop without specifying a network interface causes it to listen on the first external interface it can find.
Using the flag -i, we can run iftop on a specific interface:
$ iftop -i loThe command above makes iftop listen on the lo interface.
By default, iftop attempts to look up the IP for each socket connection in order to obtain its DNS. However, this might be undesirable as it imposes some network overhead during the DNS resolution.
To disable the DNS resolution, we can launch iftop with the flag -n:
$ iftop -n With iftop, it is also possible to monitor a particular network using the flag -F. For example, we can narrow down the network monitoring to the network block 192.168.0.1/16:
$ iftop -F 192.168.0.1/16The command will start iftop that only monitor any traffic that flows in and out of any address that falls into the 192.168.0.1/16 network block.
Instead of a CIDR notation, a network mask can be used. For example, the command above command can be replaced using an explicit mask:
$ iftop -F 192.168.0.1/255.255.0.0nethogs is yet another command-line tool for monitoring network usage. It groups network traffic on a network interface by the process ID that generates or receives the network traffic. As a result, we’ll be able to monitor the network bandwidth consumption of different processes.
To install nethogs in Debian based Linux, we’ll use the apt-get command:
$ apt-get install -y nethogsA similar installation can be performed on RHEL based Linux with yum:
$ yum install -y nethogsLet’s run the nethogs command without any arguments:
$ nethogsImmediately we’ll be presented with an interactive screen.
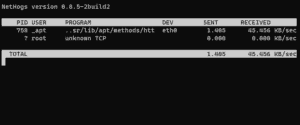
The screen shows the bandwidth consumed by each process.
The PID column shows the process ID this row of information corresponds to. Then, the user that starts the process is displayed in the USER column. Subsequently, the PROGRAM column shows the program that is consuming the bandwidth.
On the DEV column, we can see the name of the interface. Finally, the SENT and RECEIVED columns show the number of bytes sent and received by this process respectively.
To cycle between different display modes, we can press the m key. The different display modes available are kilobyte per second, kilobyte, byte, and megabyte.
Note that out of the four different modes, only the first is displaying rate information. The rest of the display modes are displaying the quantity of data transferred in different metrics prefix.
We can also interactively sort the rows by RECEIVED or SENT values. Pressing the r key will sort the rows by RECEIVED column. On the other hand, pressing the s key sorts the rows by SENT column.
To change the refresh interval, we can use the flag -d:
$ nethogs -d 2The command above starts a nethogs instance with a 2 seconds refresh rate.
For monitoring purpose, we can start nethogs in trace mode:
$ nethogs -t
In trace mode, the reports are generated and appended to the console output. Therefore, providing us a stream of reports over time that can be used for further processing.
In this article, we’ve looked at the different network monitoring tools that are available in Linux. Then, we started off by explaining how these tools can be grouped by the level of details they provide when reporting the network usage of a system.
After that, we’ve started off with the simplest tool nload. We see how nload reports the network usage on the network interface by summing up all the network traffic.
Additionally, we’ve also looked at the speedometer. Although it is quite similar to nload, speedometer provides varieties of display customization.
Then, we saw how iftop allows us to monitor the network traffic grouped by their respective connection socket. As a result, it provides more depth in the information when compared to nload and speedometer.
Finally, we explored how nethogs allows us to monitor the network traffic grouped by their respective process ID.