

Yes, we're now running our only Summer Sale. All Courses are 30% off until 20th July, 2026:
Learn through the super-clean Baeldung Pro experience:
>> Membership and Baeldung Pro.
No ads, dark-mode and 6 months free of IntelliJ Idea Ultimate to start with.
1. Overview
In this tutorial, we’ll integrate a load test within a Jenkins pipeline using Gatling. First of all, let’s make sure we’re familiar with the concepts of Gatling.
2. Create a Gatling Project With Maven
Our goal is to insert a load test with Gatling into a Jenkins CI/CD pipeline. In order to automate this verification step, we can pack the tool using Maven.
2.1. Dependencies
Gatling provides a plugin – the Gatling Maven Plugin – which allows us to launch load tests with Gatling during the Maven build phase of the project. In this way, it’s possible to integrate the load test into any Continuous Integration tool.
So, let’s integrate Gatling into a sample Maven project. First, we need the following dependencies in our pom.xml file:
<dependency>
    <groupId>io.gatling.highcharts</groupId>
    <artifactId>gatling-charts-highcharts</artifactId>
    <version>3.10.5</version>
</dependency>
<dependency>
    <groupId>io.gatling</groupId>
    <artifactId>gatling-app</artifactId>
    <version>3.10.5</version>
</dependency>
<dependency>
    <groupId>io.gatling</groupId>
    <artifactId>gatling-recorder</artifactId>
    <version>3.10.5</version>
</dependency>
In addition to the previous dependencies, we need to specify the gatling-maven-plugin in the plugin section of the pom.xml:
<plugin>
    <groupId>io.gatling</groupId>
    <artifactId>gatling-maven-plugin</artifactId>
    <version>4.8.1</version>
    <configuration>
        <simulationClass>org.baeldung.${SimulationClass}</simulationClass>
    </configuration>
</plugin>
The SimulationClass value represents the simulation class used to perform the load test. The Gatling version and Gatling Maven Plugin version don’t have to be the same. Here, we can find the latest version of Gatling, while at the following link we can find the latest version of the Gatling Maven Plugin.
2.2. Creating a Scenario
A simulation consists of a scenario, which can contain the execution of several requests.
Simulations are written in Scala, using Gatling’s DSL, which is simple and intuitive.
2.3. Running the Scenario
Once we’ve written the code necessary to execute the load test, we can build the project and run the simulation:
mvn clean package
mvn gatling:test
Inside the generated target folder, we can find the report of the load test performed by Gatling.
3. Integrate Gatling With Jenkins
Integrating Gatling into a Jenkins pipeline allows us to perform load tests during its execution.
In this way, we can verify that the changes made in the code we’re releasing don’t introduce significant drops in performance.
This increases reliability and confidence in the new code to be issued.
3.1. Create the Jenkinsfile
Within our project, we create a Jenkinsfile instructing it how to run Gatling:
pipeline {
    agent any
    stages {
        stage("Build Maven") {
            steps {
                sh 'mvn -B clean package'
            }
        }
        stage("Run Gatling") {
            steps {
                sh 'mvn gatling:test'
            }
            post {
                always {
                    gatlingArchive()
                }
            }
        }
    }
}
The script is divided into two stages:
- Build the project (Maven)
- Run and archive our scenarios (Gatling)
Next, we commit and push the test code to our source management system. Once configured, Jenkins will be able to read and execute the newly created script.
3.2. Create the Pipeline
Using this JenkinsFile, we’ll create our own pipeline. Creating a pipeline in Jenkins is simple.
Let’s first navigate to the Jenkins home page, and click on New Item, select Pipeline and give it a meaningful name. To learn more about creating a pipeline in Jenkins, we can visit our tutorial dedicated to the topic.
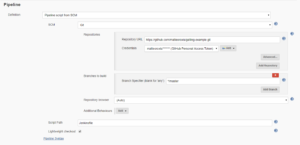
Let’s configure the newly created pipeline. In the Pipeline section, we select the source of the script.
In particular, let’s select from the drop-down menu Pipeline script from SCM, set the URL of our repository, set the credentials needed to retrieve the source code, supply the branch from which to receive the script, and finally indicate the path where to find our newly-created Jenkinsfile.
The window should appear as follows:
3.3. Gatling Jenkins Plugin
Before running the newly created pipeline, we need to install the Gatling Jenkins Plugin.
The plugin allows us to:
- Obtain and publish detailed reports at each pipeline run
- Keep track of each simulation and provide trend graphs
The gatlingArchive() command inserted into the pipeline is part of this plugin, and it’s the one that allows us to enable the reports just mentioned.
Let’s install the plugin and restart Jenkins.
At this point, the pipeline with our load test is ready to be run.
3.4. Separate a Load Generation
Generating a load of calls to perform the test is quite an expensive operation in terms of resources. For this reason, it’s not a good idea to perform these operations on the master Jenkins node that’s running the pipeline.
We’ll use a Jenkins slave node to perform some of the steps in the pipeline.
Suppose we’ve correctly configured one or more slave nodes on Jenkins; the agent any command inserted into the newly-created pipeline allows us to allocate an executor node and run the specified code on that node.
4. Run the Pipeline
It’s time to run our pipeline.
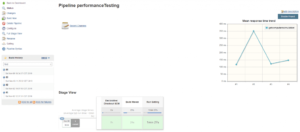
From the Jenkins home, we select the newly created pipeline and click Build Now. We then wait for the pipeline to run. At the end of the execution, we should see a chart similar to this:
5. View the Result
In the execution page of our pipeline, we can see how a graph has been generated, which shows the average response times generated by our load test. The graph is generated by the Gatling Jenkins Plugin. It will contain the data of the last 15 builds, so as to give immediate evidence of the performance trend of our releases.
If we click on the Gatling button in the menu on the left, inside the execution page of our pipeline, we’ll see graphs showing the trend of our last 15 builds.
In particular, we’ll have information about:
- Average response time
- 95th percentile of the response time, and
- Percentage of requests in “KO” (that is, “not okay”)
At the bottom of the page, after the graphs just mentioned, we’ll find links to the Gatling reports generated for each of the builds made.
By clicking on the links, we can view, directly within Jenkins, the Gatling reports that have been generated:

6. Conclusion
In this tutorial, we’ve seen how to insert load tests performed with Gatling into a Jenkins pipeline. We started by explaining how to generate a load test with Gatling, how to create a Jenkinsfile to run it, and how to integrate it into a Jenkins pipeline.
Finally, we’ve shown how the Gatling Jenkins Plugin is useful to generate Gatling reports directly inside our Jenkins deployment.
To learn more about how to structure a test scenario to monitor the performance of a website, let’s visit another Gatling tutorial of ours.
As always, the full source code of the tutorial is available over on GitHub.