

Yes, we're now running our only Summer Sale. All Courses are 30% off until 20th July, 2026:
Learn through the super-clean Baeldung Pro experience:
>> Membership and Baeldung Pro.
No ads, dark-mode and 6 months free of IntelliJ Idea Ultimate to start with.
1. Introduction
In this tutorial, we’ll study percentiles and their application to network latency and application response time.
2. Percentiles
A percentile of a distribution or a sample is a value greater than the given percentage of observations in the same group.
For example, if we say that Sam’s GRE score lies in the  percentile, then we want to say that Sam has performed better than
  of all GRE test givers.
So, we use percentiles to express how a given value compares to others in the same set. The following figure illustrates and  percentile for a normal distribution of a test score with mean value
  and standard deviation
  :
:
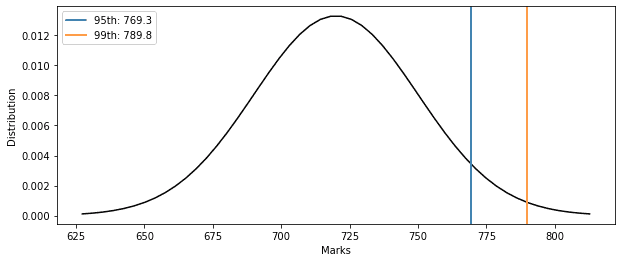
As evident in the figure, the percentile value is 769.3, and the percentile value is 789.8.
More formally, the  percentile of a distribution (
 ) is greater than or equal to
  % of values in the same distribution. We can calculate the percentile of a finite sample, in which case we’re talking about the sample estimates, not distributional percentiles.
2.1. Percentile vs. Percentage
Percentile is not the same as percentage.
The key difference is that a percentage is a part of a unit, whereas a percentile is a value that a specific percentage of other values from the same group is smaller from.
3. Latency Percentiles
We define latency as the total time it takes for a data packet to travel from its origin to its destination. We usually refer to latency in the context of a network. Network latency is one of the key values we use to define the quality of service that a provider offers to a customer. We usually measure latency in milliseconds.
The lower the latency, the better the user experience.
3.1. P99 Latency
We usually describe latency with its 99th percentile or P99.
So, if we say that our HTTP-based web application has a P99 latency of less than or equal to 2 milliseconds, then we mean that  % of web calls are serviced with a response under 2 milliseconds. Conversely, only
  of calls get a delayed response of over 2 milliseconds.
3.2. Why P99 Latency?
People often use basic statistical measures such as the minimum, mean, median, or maximum value to describe a data set. The problem with these statistics is that they may be bad at describing data. The mean and median often mask outliers, whereas minimum or maximum may give us an outlier.
Network administrators aim to optimize the  percentile of network latency to improve the overall response time with peak load. They also use percentile-based alerts for monitoring as these don’t have high false-positive rates. Also, such alerts are a lot less volatile and thus depict important performance degradation events.
So, the P99 latency is greater than almost all latencies, so optimizing it is like maximizing the performance in the worst case. However, since P99 isn’t the maximal value, we expect it not to be influenced by outliers.
4. Percentile Calculation
Let’s say we have a dataset  of
of  latency records.
To calculate the P99 latency, we first sort the dataset non-decreasingly. Let the rank of a latency value be by its index in the sorted array. The rank of the  percentile is then:
![\[Rank_{p} \; = \; ceil(\frac{p}{100} * n)\]](/wp-content/ql-cache/quicklatex.com-453c527132dcf1f8df06321bb95d7ab1_l3.svg "Rendered by QuickLaTeX.com")
Now, we get the percentile as:
![\[Percentile_{p} \; = \; d[Rank_{p}]\]](/wp-content/ql-cache/quicklatex.com-018cb6025242d5bde29692974f65c191_l3.svg "Rendered by QuickLaTeX.com")
4.1. Example
Let’s apply these formulae. Let’s say we have the quiz marks of 15 students in a class:
| Marks | 89 | 92 | 34 | 45 | 67 | 75 | 37 | 55 | 66 | 44 | 98 | 99 | 77 | 72 | 39 |
|---|
To compute their  percentile, we first sort them:
| Percentile Rank | 1 | 2 | 3 | 4 | 5 | 6 | 7 | 8 | 9 | 10 | 11 | 12 | 13 | 14 | 15 |
|---|---|---|---|---|---|---|---|---|---|---|---|---|---|---|---|
| Marks | 34 | 37 | 39 | 44 | 45 | 55 | 66 | 67 | 72 | 75 | 77 | 89 | 92 | 98 | 99 |
Next, we find the percentile rank of P90:
![\[Rank_{90} \; = \; ceil(\frac{90}{100} * 15) \; = \; ceil(13.5) \; = 14\]](/wp-content/ql-cache/quicklatex.com-e686c6257bc72726498d6aa429ba0627_l3.svg "Rendered by QuickLaTeX.com")
Finally, we get the percentile:
![\[Percentile_{90} \; = \; d[Rank_{90}] \; = \; d[14] \;=\; 98\]](/wp-content/ql-cache/quicklatex.com-57425e24ec8bb7ac4230b76199de8fac_l3.svg "Rendered by QuickLaTeX.com")
So, for this dataset, we can say that  of students got marks less than or equal to 98.
5. Percentiles and Confidence Intervals
If we take a sample of elements from a dataset having  ( is much larger than ), the sample’s percentile may differ from that of the entire dataset. Here, the larger the sample, the more precise our estimate will be.
This is similar to the case with latency. When dealing with it, we record latencies and assume they follow the same but unknown distribution. Then, we treat the records as a sample. To account for possible fluctuations of the sample estimate around the actual P99 when generalizing the results to all future latencies, we can construct confidence intervals (CI).
A CI of P99 is the range of values that contain the distributional P99 with predefined confidence. For instance, if ![[a, b]](/wp-content/ql-cache/quicklatex.com-1697b646881a88b3a6029defcd0dd8f6_l3.svg "Rendered by QuickLaTeX.com") is the CI with the confidence of 80%, that means that 80% of the CIs we construct in the same way as (but by using other samples) will contain the distributional P99.
is the CI with the confidence of 80%, that means that 80% of the CIs we construct in the same way as (but by using other samples) will contain the distributional P99.
We can use order statistics to construct a CI for P99. In order statistics, we arrange all the sample values in ascending order and then do our analysis. We employ order statistics in applications such as process simulation, network modeling, actuarial products, and optimizing production processes.
5.1. Order Statistics
Let our sorted set of latencies be  , and let
  be the set’s percentile. Let
  be the desired level of confidence. Since P99 follows the binomial distribution with parameters and 0.99, we find the ranks
  and
and  such that:
![\[Probability(d_i \leq P99 \leq d_j) = \sum_{k=i}{j} \binom{n}{k} 0.99^i \times 0.01^{1-i} \geq q\]](/wp-content/ql-cache/quicklatex.com-8a471406bbd3131c960b065cc96cf97c_l3.svg "Rendered by QuickLaTeX.com")
Then, we can say that the actual latency is between  and
and  with the confidence of . With a large , we can use the normal approximation to calculate the CI more easily. However, the more recorded latencies, the narrower the CI. So, if we have a lot of records, we can skip this step and report the sample estimate instead of the interval.
6. Conclusion
In this article, we have gone through percentiles, latency, and their relationship. Percentiles give us a more realistic and intuitive understanding of the actual performance characteristics of our network or application.
We use the percentile to monitor and improve the overall network latency or our application response time. Percentiles help us distinguish between outliers and real effects.