

Yes, we're now running our only Summer Sale. All Courses are 30% off until 20th July, 2026:
What Is the Difference Between Tracing and Logging?
Last updated: March 11, 2024
Learn through the super-clean Baeldung Pro experience:
>> Membership and Baeldung Pro.
No ads, dark-mode and 6 months free of IntelliJ Idea Ultimate to start with.
1. Introduction
Logs and traces are essential tools in the context of systems observability. These two terms are often mixed up because of their similarities.
In this tutorial, we’ll systematically study the main differences between tracing and logging.
First, we’ll examine observability and its correlation with logs and traces. Next, we’ll examine the concept of log and trace. Finally, we’ll systematically compare both terms.
2. Systems Observability
Observability is a field of computer science whose primary purpose is to provide better system visibility. In its most complete sense, observability is a system property that indicates how much we can know about its state from its outputs and performance metrics. Thus, observability allows us to test, understand, and debug systems deeply.
In complex systems, observability is a crucial property. This is the case for distributed systems. Those systems are composed of multiple components that communicate with each other to achieve a common goal. Furthermore, the components of a distributed system can be located on a single machine or even on different computers spread around the world.
There are three pillars of observability: logs, metrics, and traces. In this article, we’ll discuss and compare logs and traces.
3. Logging
Now, let’s study what logs are.
3.1. Definition of Logs
Over time, a system changes state many times. In this context, a change of state is an event that has occurred in the system. Therefore, occurrences such as an error when writing to a file, new access to the system, or the addition of a user account, are examples of events.
A log is a time-stamped record of discrete events that have occurred over time in a system. Therefore, a log provides an ordered history of the occurrence of events in a system.
3.2. Composition and Formats
Event logs generally consist of two parts: a timestamp and a payload. The payload describes the event that occurred. The timestamp is essential for knowing when each event occurred.
Usually, event logs come in three different formats: plaintext, structured, or binary. In plain text format, a log record is a message described in free form (easy for humans to understand). In structured logs, each event is usually divided into specific fields and also saved in specific file formats (such as JSON, for instance). Meanwhile, logs in binary format are useful for other systems or tools to consume (MySQL binlogs, systemd journal logs, etc.).
3.3. Log Levels
Logs can easily become massive in complex systems. Therefore, we typically use log levels to filter out relevant information.
The most common levels are FATAL, ERROR, WARN, DEBUG, INFO, and TRACE. These levels are organized on a scale of criticality. Therefore, events at the FATAL level are the most critical, while events at the TRACE level are merely informative. Note that we can’t confuse the TRACE log level with the tracing we’ll discuss next.
Based on these levels, developers can map which events in a system are more or less critical. On the other hand, system administrators can select which types of events to log based on the log levels.
The figure below illustrates an example of a real system log:

4. What Are Traces?
Let’s examine the concept of traces.
4.1. Definition of Traces
When a system is composed of multiple components, it’s essential to be able to observe the interaction between them. Thus, it involves capturing information regarding individual requests, notifications, or transactions as they propagate through different components. This is exactly the idea behind traces.
In particular, communication between components generates events with a cause-and-effect relationship. For example, the sending of a response occurs after a request. Therefore, we can define traces as a representation of a series of causally related distributed events that capture the interaction between the components of a system.
4.2. Representation of Traces
Generally, the structure of a trace is almost the same as that of an event log. However, some additional attributes are essential for representing interaction events between system components.
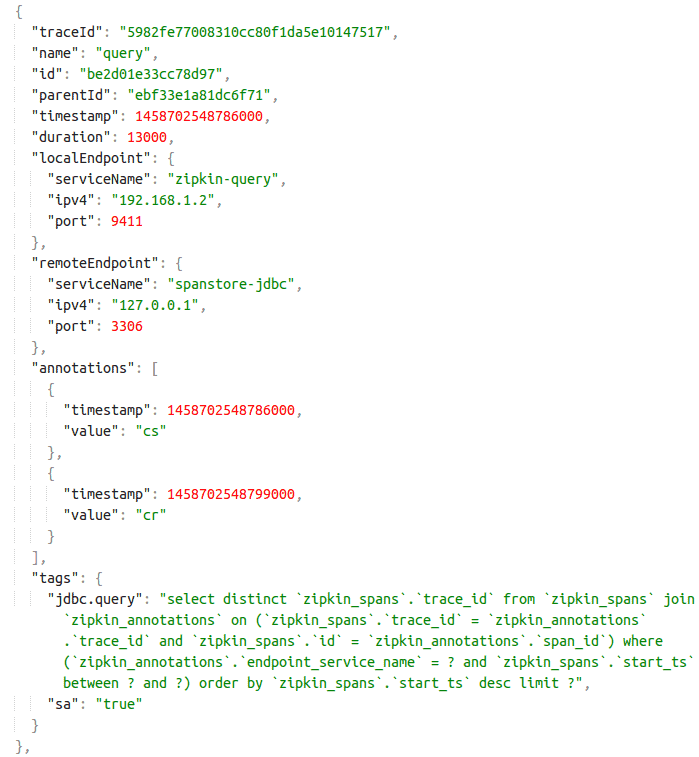
In this sense, in addition to a timestamp and payload, a trace typically contains information about its origin and destination. So, by looking at a trace we can tell which components are communicating and what happened in the interaction.
The figure below illustrates an example of a trace. In this case, the trace is in JSON format and structured according to the data model of the Zipkin distributed trace system:
5. Comparison
Let’s directly compare these two concepts in different aspects.
5.1. Purpose
Logs and traces record different types of events in a system. Therefore, they’ve different purposes.
The purpose of logs is to present events related to changes in the state of a system. Basically, the logs present a history of certain instructions that each component of a system has executed.
In contrast, traces record events of interaction between components of a system. Thus, each trace describes communication between components, indicating who communicated and what was communicated.
5.2. TRACE Log Level vs. Traces
People often confuse the TRACE log level with the concept of traces. However, these two terms are very different.
In the context of logs, TRACE refers to a log level in which the records are very detailed. This is because logs at the TRACE level detail in depth, for example, the operation of an application’s method (or function) at runtime.
Therefore, the TRACE log level is generally enabled by developers when they’re trying to check the functioning of specific parts of an application. However, these fine-grained logs can also be useful for troubleshooting and understanding performance bottlenecks.
On the other hand, the concept of traces is quite different: as we’ve seen previously, traces are records that capture the events of interaction between the components of a system.
5.3. Tracing vs. Logging: Which One to Choose?
Traces and logs are complementary and together allow for greater observability of systems. Therefore, we don’t recommend choosing one or the other, but rather an adequate combination of both.
As an example, let’s say we need to troubleshoot an issue in a distributed system. Looking at the traces, we can, for example, see that component A made a particular request to B, but B returned a message indicating that it failed to process the request. However, we don’t know exactly why this failure occurred.
In this case, we can consult the event log of component B and observe what happened inside component B when processing the request from A.
5.4. Summary
The below table summarizes the main differences between logs and traces.
| Aspect | Logs | Traces |
|---|---|---|
| Purpose | Record events related to system state changes | Record events of interaction between system components |
| Content | Records of events with a timestamp and contextual payload | Similar to logs, but with additional information on the source and destination of interactions |
| Levels of Detail | Varied, can be filtered by log levels | Captures detailed interaction events between components |
6. Conclusion
In this article, we’ve studied the differences between logging and tracing. As we’ve learned, both play complementary roles, contributing to the system’s observability.