Learn through the super-clean Baeldung Pro experience:
>> Membership and Baeldung Pro.
No ads, dark-mode and 6 months free of IntelliJ Idea Ultimate to start with.
Last updated: April 3, 2024
In this tutorial, we’ll explain the concept of p-value hacking in research and provide some examples.
P-value hacking or p-hacking refers to research malpractice whose goal is getting statistically significant results.
Usually, we asses our research hypotheses through significance tests. We collect samples, choose the adequate statistical test, compute its statistic, and calculate the statistic’s p-value. The result is statistically significant if the corresponding p-value is lower than the chosen significance threshold (0.01 or 0.05). Significant results mean rejecting the null in favor of the alternative hypothesis.
The null hypothesis typically states there’s no effect, e.g.:
The alternative hypothesis states there’s an effect, e.g., that the drug is effective or that two factors, such as age and party membership, are correlated. So, most of the time, the alternative hypothesis is what we want to prove.
Journals prefer significant results because they constitute evidence for scientific hypotheses (for instance, that a new drug is more efficient than the old therapy). In contrast, non-significant results mean that we failed to find evidence. Given the pressure to “publish or perish,” several techniques have emerged in the scientific communities as “boosters” of significance that increase a manuscript’s chance of publication. They’re known as p-hacking and are regarded as research malpractice, although not all instances of it are intentional. Let’s check out two such methods.
Here, we’re simultaneously testing our data as we’re collecting them. After each sample or batch, we perform a statistical test and calculate the p-value. If it’s lower than 0.01 or 0.05, we stop data acquisition. Otherwise, we collect more data and re-evaluate the test. This is repeated until we either get a significant result or can’t collect more samples.
This is considered malpractice because we’re adapting our data to fit the hypothesis we want to prove and stopping just when we think we’ve succeeded. Given that the p-values are uniformly distributed over under the null hypothesis, enlarging the dataset will eventually result in a significant p-value and incorrect rejection of the null even if the null holds.
Let’s say we’re testing a drug for insomnia. In the experiment, patients reported how many hours they had slept the night they took the drug and the day before. If the drug works, we expect them to sleep more the night they took the medicine. So, we conduct a related-samples t-test with the following null and alternative hypotheses:
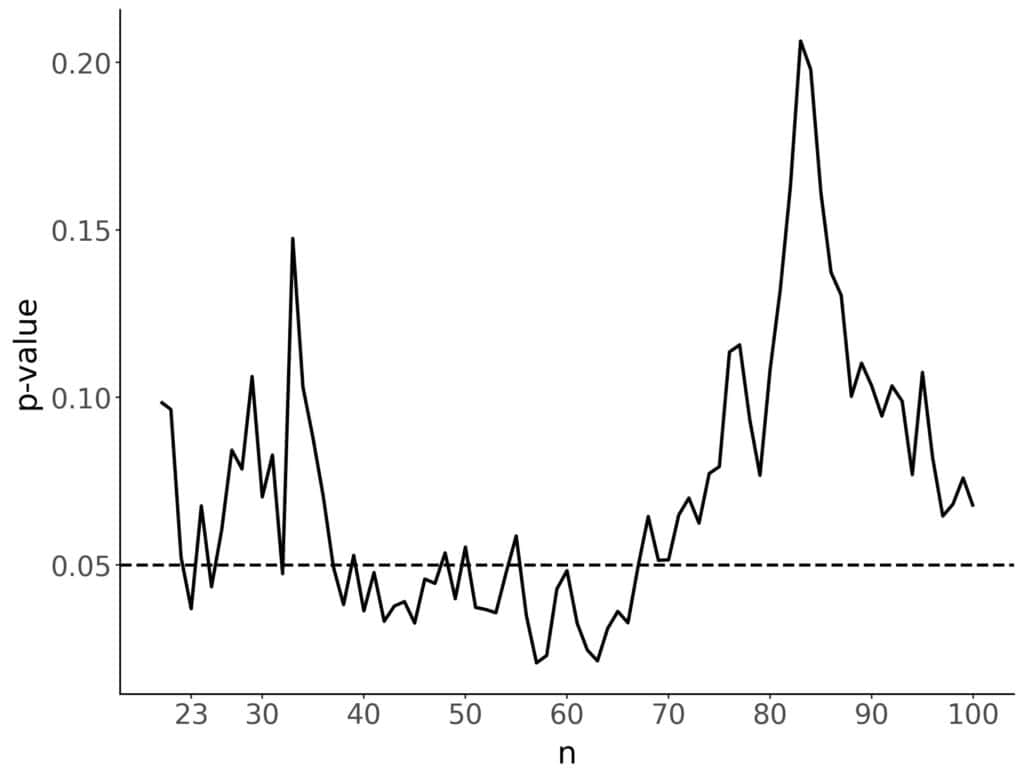
We’ll simulate the two groups by drawing samples from the same distribution, the normal with a mean of 5 and a standard deviation of 1. Let’s check what happens if we keep adding patients one by one and calculating the p-values after each new test subject:

We got the first significant result after including the third additional patient. However, if we keep adding more patients, the p-value won’t stay under the 0.05 threshold. It rises above and falls below it several times. So, just because the p-value got under the significance threshold once, it doesn’t mean it won’t go up. In fact, in our example, the p-value is larger than 0.05 in most cases. There’s no way to justify using the first p-value lower than the significance threshold and ignoring the rest.
Outliers are extreme values in a sample that are too small or too large compared to the rest of the data. We can justify their exclusion by saying they’re too different from the typical values and that by disregarding them, we focus our analysis on the subjects (measurements) we’re most likely to encounter in practice.
However, there’s no universal definition of “too large” and “too small.” As a result, there are many ways to define outliers, e.g.:
This flexibility allows researchers to choose the outlier definition that makes the results significant.
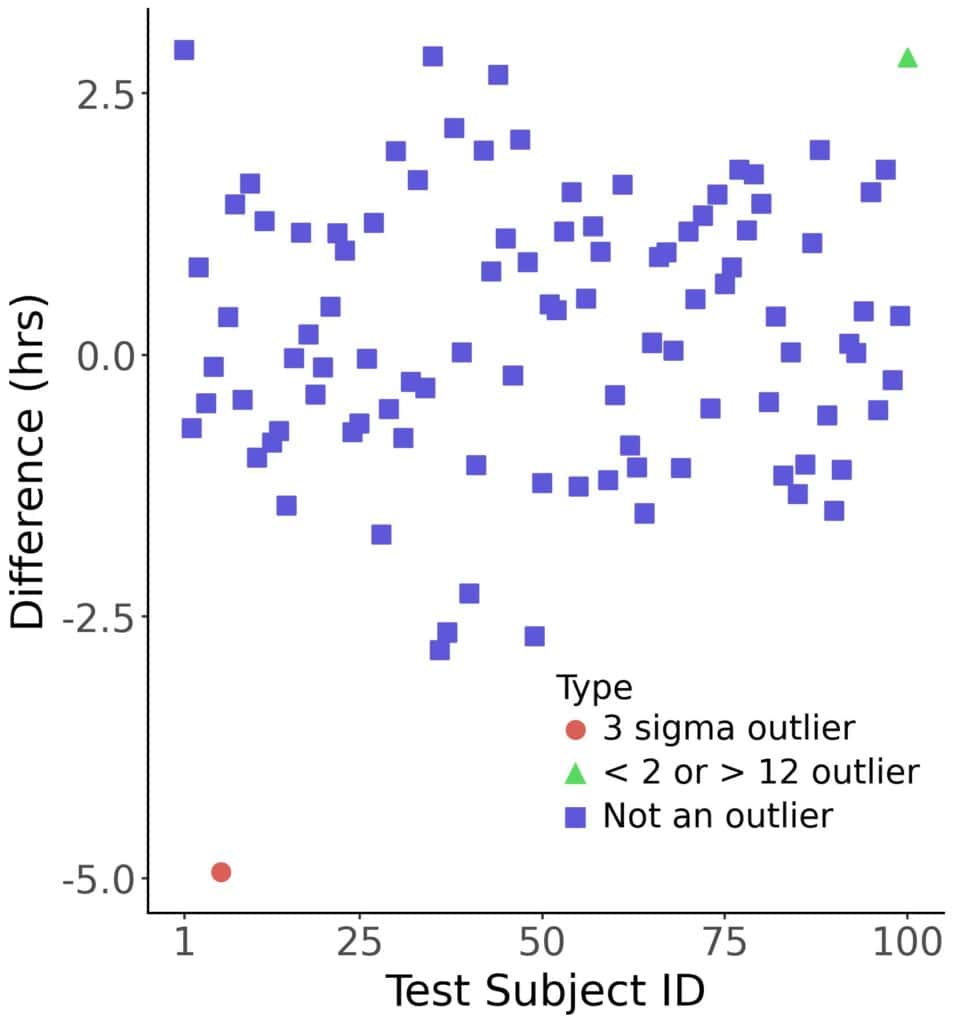
Let’s say we tested a sleeping drug on 100 patients with insomnia and recorded their sleep durations the day before and the night they took the drug. Then, we calculated the differences and decided to use the one-sample t-test to check if the differences were equal to zero or greater than it. In this simulation, we drew the values from a normal distribution with a mean of 8 and a standard deviation of 1. The results turned statistically insignificant, with a p-value of 0.075.
That’s pretty close to the usual threshold of 0.05, so we check what happens if we exclude outliers. We can define them as the differences related to the patients whose sleep durations on either night are not within three standard deviations from the means (for the respective night). The 3-sigma rule is not uncommon in statistics, so feel comfortable using it, and voila! We exclude one test subject and get a p-value of 0.027.
However, we can define outliers in other ways. For instance, we can say that sleep durations shorter than one hour and longer than twelve hours are unusual and can be disregarded. This outlier definition results in excluding a different test subject, which yields a p-value of 0.105:

The 3-sigma rule excluded one subject who slept 5 hours less having taken the medicine, which gave us a significant result. The second rule kept the subject in the sample but excluded another one, yielding a p-value greater than 0.1. Both outlier definitions make sense but lead to different conclusions. Using the one that’s convenient for us isn’t scientifically warranted (unless there’s another reason why the more convenient outlier definition is preferred).
To avoid p-hacking, we can preregister our experiment’s design and analysis plans on a public website. This includes all the decisions related to data acquisition and statistical techniques with which we’ll analyze data:
Preregistration should stop us from resorting to p-hacking even if we get a temptation to do it.
We can also use Bayesian statistics to avoid p-values and the associated problems. However, there’s a related problem in Bayesian methods: B-hacking, i.e., boosting the Bayes factor to confirm the hypothesis we want to prove.
In this article, we defined p-value hacking in statistics and explained it through examples. It refers to tailoring data acquisition and analysis to get statistically significant results (supporting the hypothesis we want to prove). Preregistering data collection and analysis plans can reduce the chance of intentionally or unintentionally p-hacking.