Learn through the super-clean Baeldung Pro experience:
>> Membership and Baeldung Pro.
No ads, dark-mode and 6 months free of IntelliJ Idea Ultimate to start with.
Last updated: February 28, 2025

Learn through the super-clean Baeldung Pro experience:
>> Membership and Baeldung Pro.
No ads, dark-mode and 6 months free of IntelliJ Idea Ultimate to start with.
In this tutorial, we’ll describe and compare two commonly used machine learning metrics, accuracy and AUC. Firstly, we’ll introduce and describe both metrics.
After that, we’re going to make a comparison between them and propose in which cases to use them.
In machine learning and data science, the term accuracy is inevitable almost in every classification task. This is the most popular measurement or metric used to evaluate models for classification.
In order to calculate accuracy, we only need to compare the prediction of the model with real classes. From that, we calculate the accuracy as
(1) 
According to this formula, the accuracy is higher if the model has more correct predictions. Also, the value of accuracy goes from 0 (means that there isn’t any correct prediction) up to 1 (means all predictions are correct).
Besides that, we can express the accuracy with percentages, multiplying the accuracy with 100. Most classification models, besides the prediction of the classes, also output the probability of that prediction.
One drawback of accuracy is that it’s not capable of utilizing this probability. For example, it might be that one model wrongly, with low probability or confidence, predicts some samples but another model has pretty high confidence and it makes inaccurate predictions.
In order to measure that, we’ll use another popular technique called AUC.
The name AUC stands for “area under the curve”. The curve in our case is the receiver operating characteristics (ROC) curve. It’s a statistical measure that we can use to evaluate the model predictions using a probabilistic framework.
Briefly, the ROC curve shows the relationship between false-positive rate and true positive rate for different probability thresholds of model predictions.
To recall, true positive rate (TPR) is the ratio between true positive (TP) classified samples and positive (P) samples. For example, if the goal is to predict whether the email is spam or not, we can label the spam samples as positive.
Then, the TPR is the percentage of correctly predicted spam emails among only spam emails:
(2) 
Similarly, FPR is the ratio between false positive (FP) classified samples and negative (N) samples. For instance, using the same example with spam emails, the FPR is the percentage of incorrectly classified spam messages overall non-spam messages:
(3) 
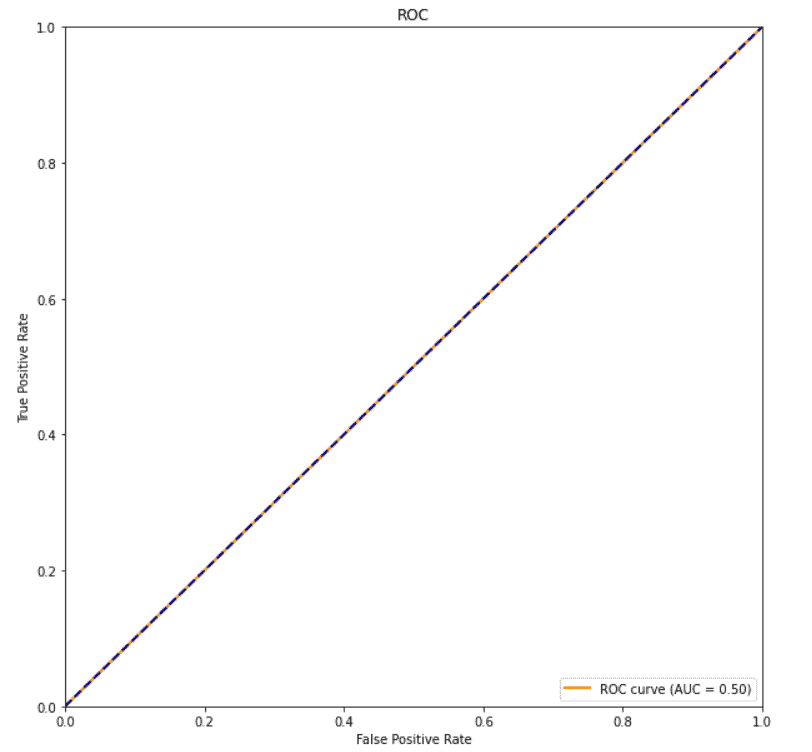
Next, if we consider the image below, we can see that there is a line that goes from (0, 0) to (1, 1) points. The first point (0, 0) indicates that all predictions are negative and the second point (1, 1) indicates that all predictions are positive.
The AUC for this line is 0.5 and it usually indicates random predictions:
Let’s imagine that our model for spam detection outputs the probability that the email is spam. Usually, the threshold or cutoff, to distinguish if the prediction is spam or not, is 0.5. So, if the probability is higher than 0.5, the email is spam and vice versa. Instead of using this cutoff, we can adjust it to any value between 0 and 1.
For example, we can take the cutoffs of 0.2, 0.5 and 0.8, and calculate TPR and FPR. After that, we plot those points and connect them with one line that represents ROC. In that way, we can measure which model has a more meaningful probability score and better separability.
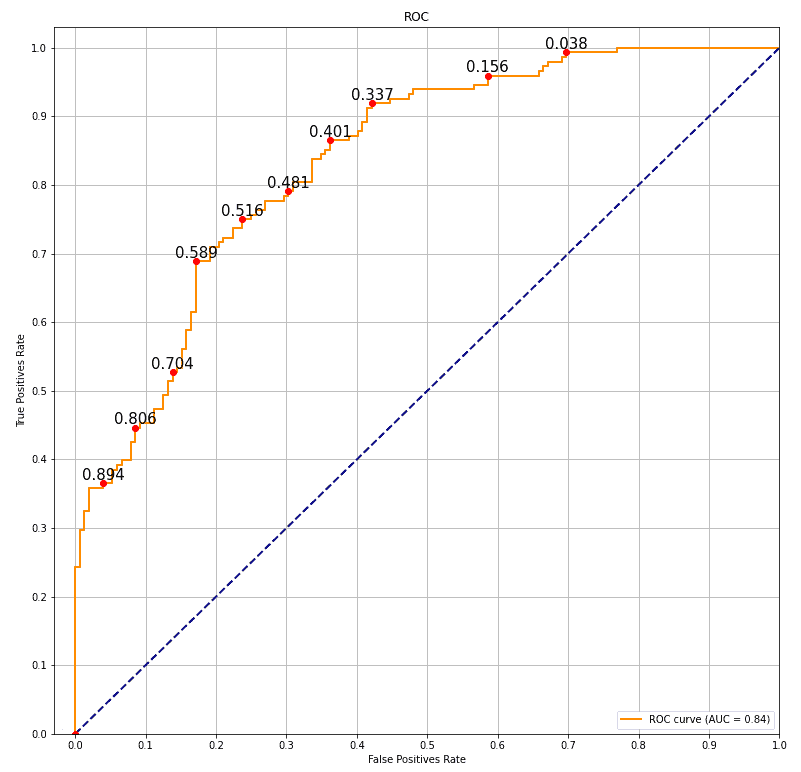
Following that logic, we see in the image below that the area under the orange curve (AUC) is equal to 0.84. Besides that, some probability cutoffs are presented as red dots on that curve. The value over the red dot is probability cutoff:
The perfect AUC score is 1 while the worst is 0. Moreover, the AUC with the value 0 means that the model reciprocating results or gives the opposite prediction for every sample.
In this section, we’ll explain the cons and pros of using AUC over accuracy.
Accuracy is a very commonly used metric, even in the everyday life. In opposite to that, the AUC is used only when it’s about classification problems with probabilities in order to analyze the prediction more deeply. Because of that, accuracy is understandable and intuitive even to a non-technical person. On the other side, AUC requires a high level of concentration and some time to understand the logic behind it.
To conclude, accuracy is a more understandable and intuitive metric than AUC.
It’s always a challenge when we need to solve a machine learning problem that has imbalanced data set. Also, it’s important to make sure that our model isn’t biased during the evaluation. For example, if the goal is to make a model that will predict if the e-mail is spam or not, it’s very likely that our data set won’t be balanced. This is because in real life, the majority of e-mails are non-spam and our original data set will be the same.
Thus, if our data set consists of 90% non-spam emails and 10% spam, accuracy won’t be the best metric for validation. For instance, if our model predicts that every email is non-spam, with the same spam ratio, our accuracy will be 90%. Because of that, usually for imbalanced data, it’s recommended to use the F1 score instead of accuracy.
Moreover, the AUC score is even more convenient due to the fact that it utilizes probabilities of prediction and F1 doesn’t. From that, our recommendation for imbalanced data set is to use AUC over accuracy.
As we’ve already mentioned, the AUC metric utilizes probabilities of class prediction. Based on that, we’re able to more precisely evaluate and compare the models.
For example, let’s assume that we have two binary classification models A and B which have 95% accuracy. Model A predicts all accurately classified classes with approximately 60% probability, while model B has for some accurately classified classes probability over 90%. It’s clear that they both have the same accuracy but model B is more convinced in its prediction.
Because of that, for some future samples, it’s more likely that model B will have also higher accuracy.
In addition, using probabilities and AUC, we can calibrate probability cutoffs and enhance our models even more. Thus, our recommendation is the AUC metric because it utilizes the probability of predictions.
In this article, we introduced and described two metrics usually used for classification problems, called AUC and accuracy. Also, we made a comparison between them providing some examples.
Lastly, we conclude that the AUC metric is more convenient because it uses probabilities of predictions and accuracy might be helpful for some simple problems.