Yes, we're now running our only Summer Sale. All Courses are 30% off until 20th July, 2026:
What Is Data Science?
Last updated: May 2, 2025

Learn through the super-clean Baeldung Pro experience:
>> Membership and Baeldung Pro.
No ads, dark-mode and 6 months free of IntelliJ Idea Ultimate to start with.
1. Overview
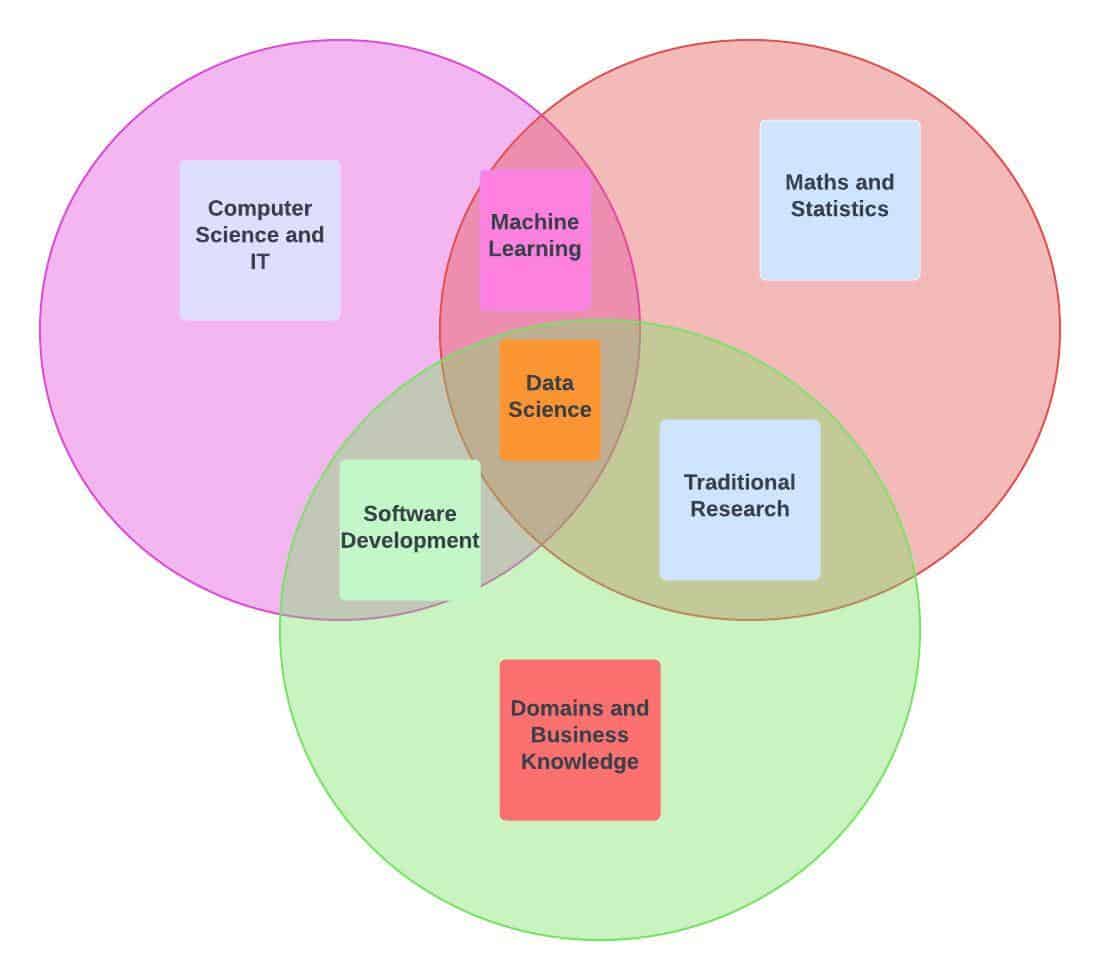
Data science is an interdisciplinary field that involves extracting insights and knowledge from structured and unstructured data. It combines elements of mathematics, statistics, computer science, and domain expertise to analyze and interpret complex data sets.
In this tutorial, we’ll start with the definition of data science. Then, we’ll discover different aspects of data science.
2. Data Science
Data science is a multidisciplinary field that combines statistical analysis, machine learning, and computer science. It’s useful to extract meaningful insights and knowledge from large and complex data sets. This branch of computer science involves applying various techniques, algorithms, and tools to collect, organize, process, analyze, and interpret data:
The primary goal of data science is to uncover patterns, trends, and correlations within data to make informed decisions and predictions.
Data scientists use various techniques, tools, and programming languages to collect, clean, and preprocess data before applying statistical models, machine learning algorithms, and data visualization techniques to extract meaningful insights.
Data science encompasses various activities, including data collection and storage, data cleaning and preprocessing, exploratory data analysis, feature engineering, model selection and training, evaluation and validation, and communicating results.
It’s commonly used in industries such as finance, healthcare, marketing, e-commerce, social media, and many others to drive decision-making, improve business processes, and gain a competitive edge.
Overall, data science aims to transform raw data into actionable knowledge that can drive data-driven decision-making and solve complex problems.
3. Process of Data Science
Data scientists use their expertise in mathematics, statistics, programming, and domain knowledge to formulate relevant questions, design experiments, and create models that can process and analyze data.
They usually work with diverse data sources, including structured data (such as databases and spreadsheets) and unstructured data (such as text, images, and videos). Data science also encompasses data visualization techniques to present findings in a clear and understandable manner. The lifecycle is shown in the following figure:
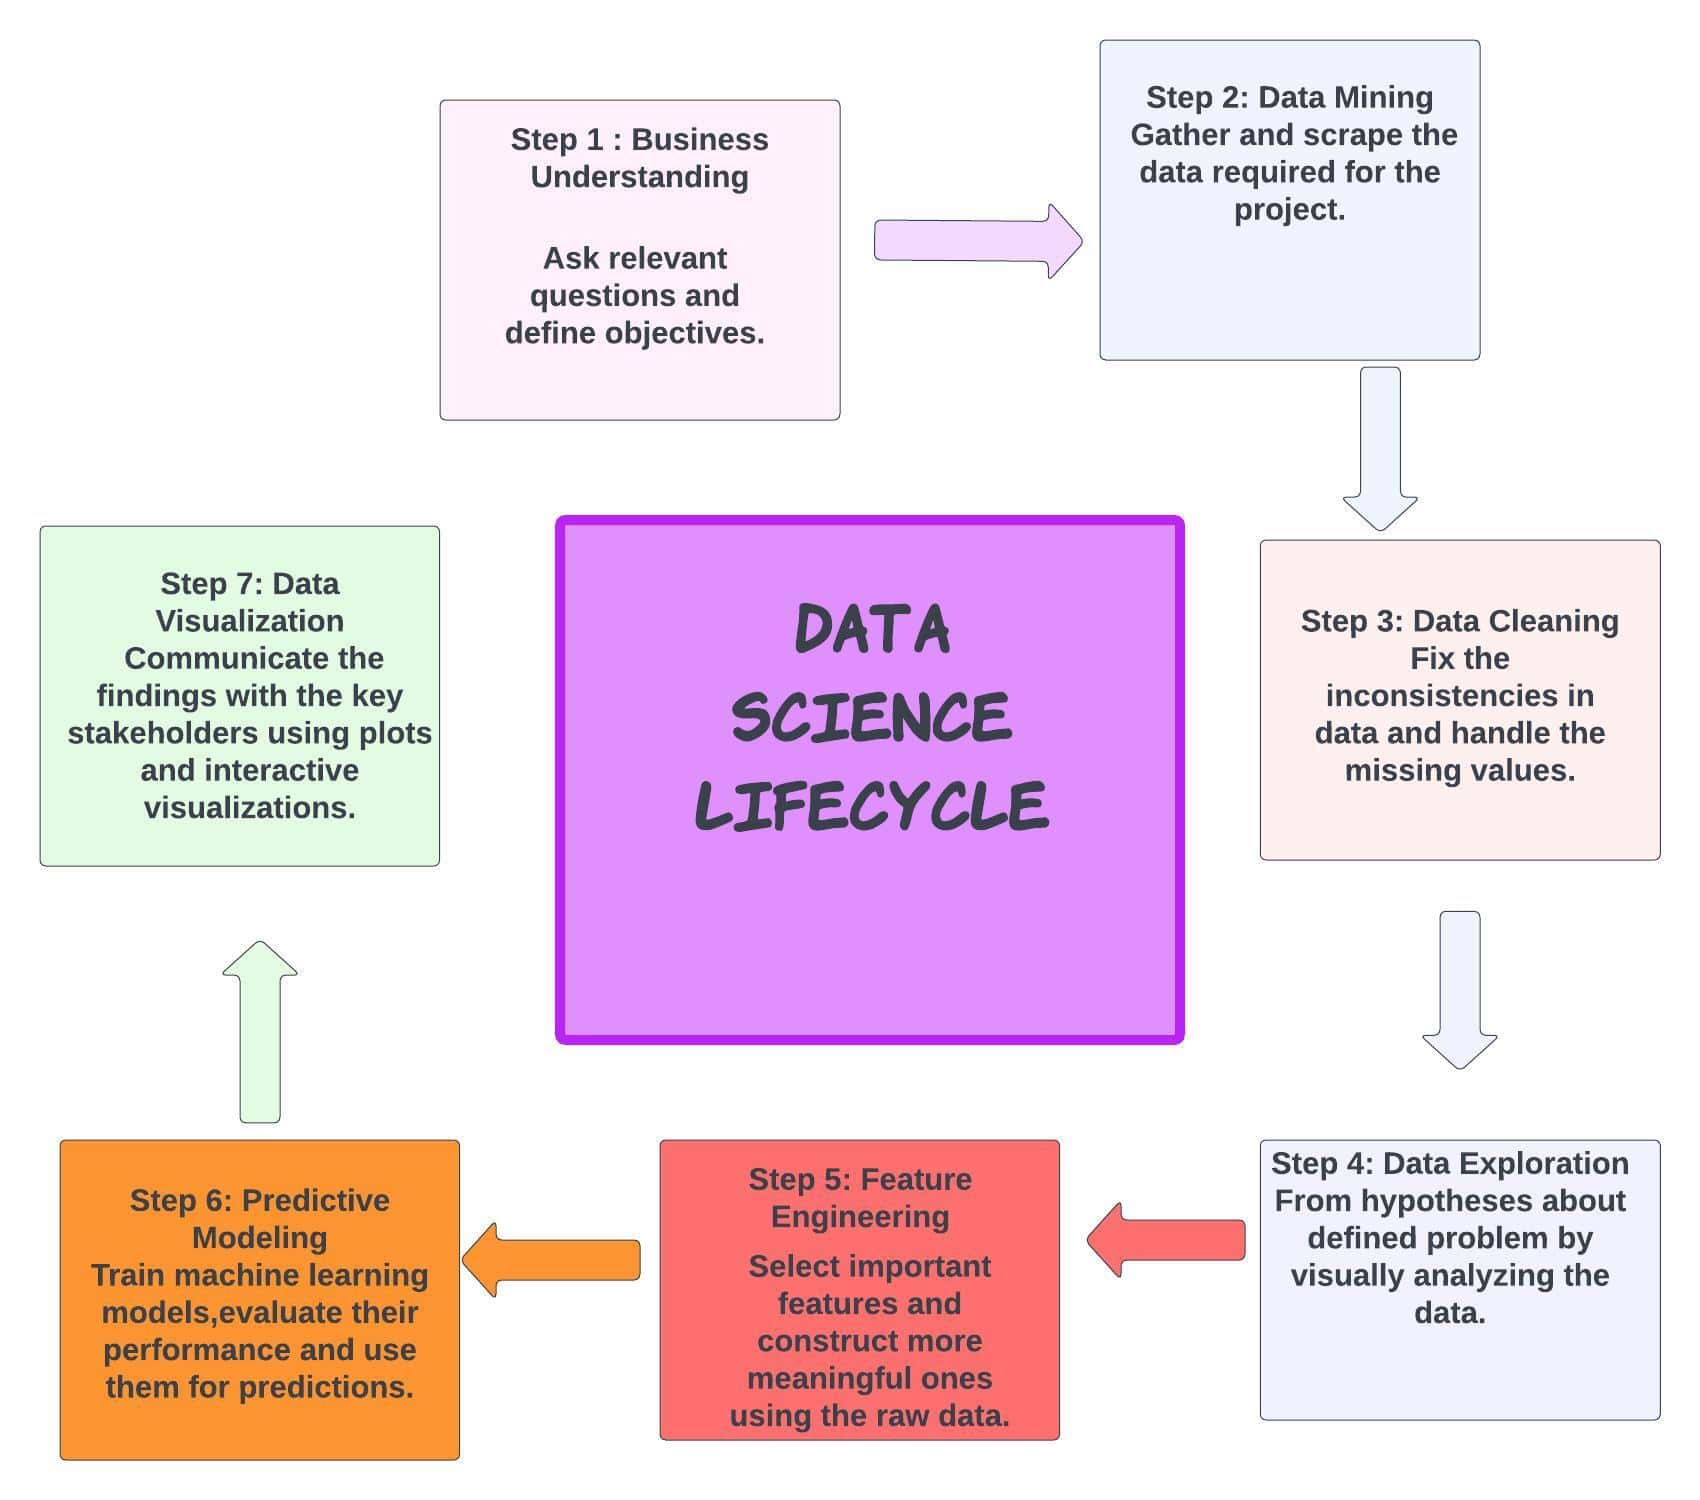
Let’s dive into the data science lifecycle.
3.1. Business Understanding
Business understanding is a crucial step in data science and analytics projects. It involves gaining a comprehensive understanding of the specific challenges or opportunities that the organization or business is facing and how data analysis can help address those issues. It requires collaboration between data scientists and stakeholders to define the problem, set clear objectives, and align the analysis with the business goals.
Thanks to business understanding, data scientists can design and execute data analysis projects that’s specifically tailored to address the challenges and meet the organisation’s objectives. It ensures that the analysis is focused, relevant, and aligned with the strategic goals of the business.
3.2. Data Acquisition
Data acquisition refers to the process of collecting or obtaining raw data from various sources for analysis and further use in data-driven projects. It involves capturing data from different types of sources, such as databases, files, sensors, web APIs, social media platforms, or manual data entry.
Data acquisition is a crucial step in the data science lifecycle as it lays the foundation for subsequent data exploration, analysis, and modelling. It’s essential to acquire high-quality and relevant data to obtain accurate insights and make informed decisions in data-driven projects.
3.3. Data Preparation
Data preparation, also known as data preprocessing or data cleaning, is the process of transforming and structuring raw data into a clean and usable format for further analysis. This involves a series of tasks aimed at improving data quality, addressing missing values, handling outliers, standardizing formats, and preparing the data for modelling or analysis:
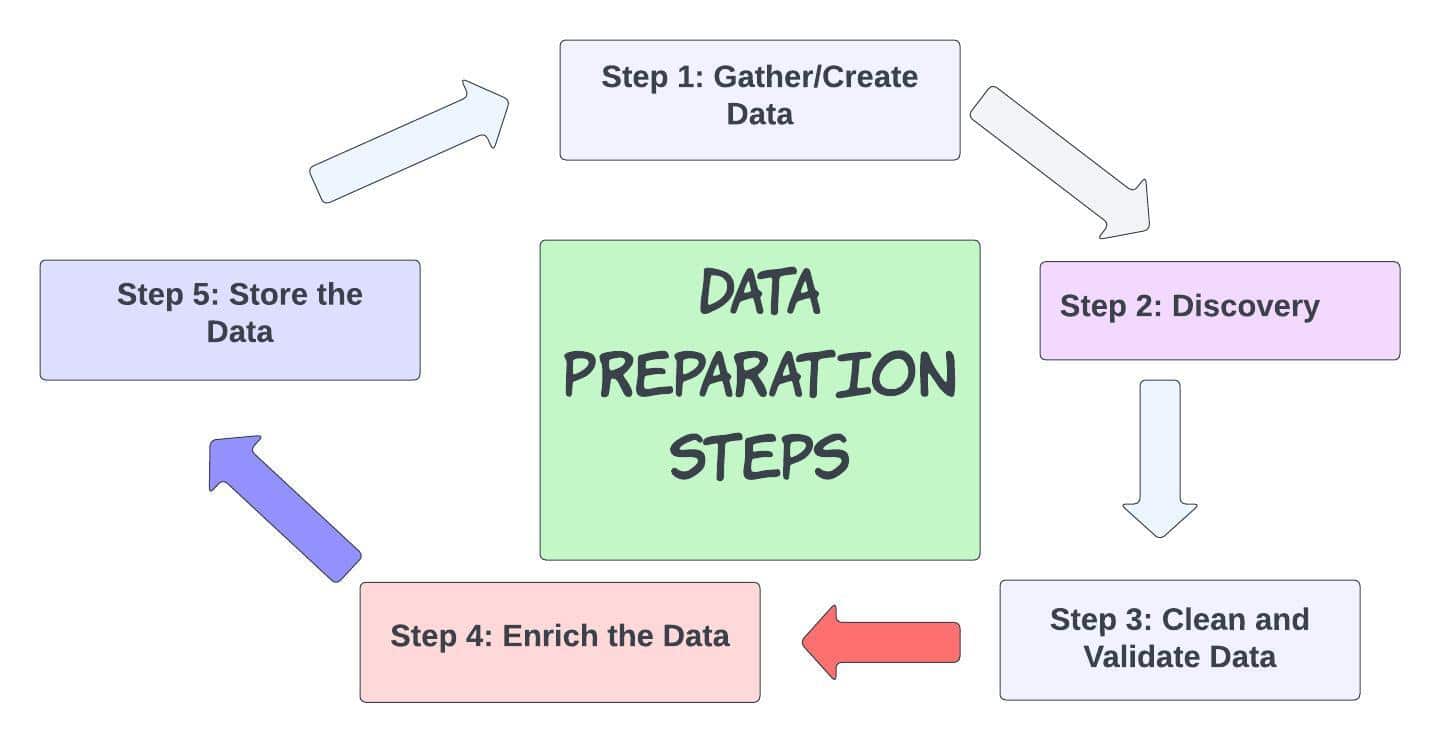
The goal of data preparation is to ensure that the data is accurate, consistent, and in a format suitable for analysis. Proper data preparation enhances the effectiveness and reliability of subsequent modelling, analysis, and decision-making processes. It plays a critical role in data science and machine learning projects, as the quality and preparation of the data significantly impact the outcomes and insights derived from the analysis.
3.4. Exploratory Data Analysis
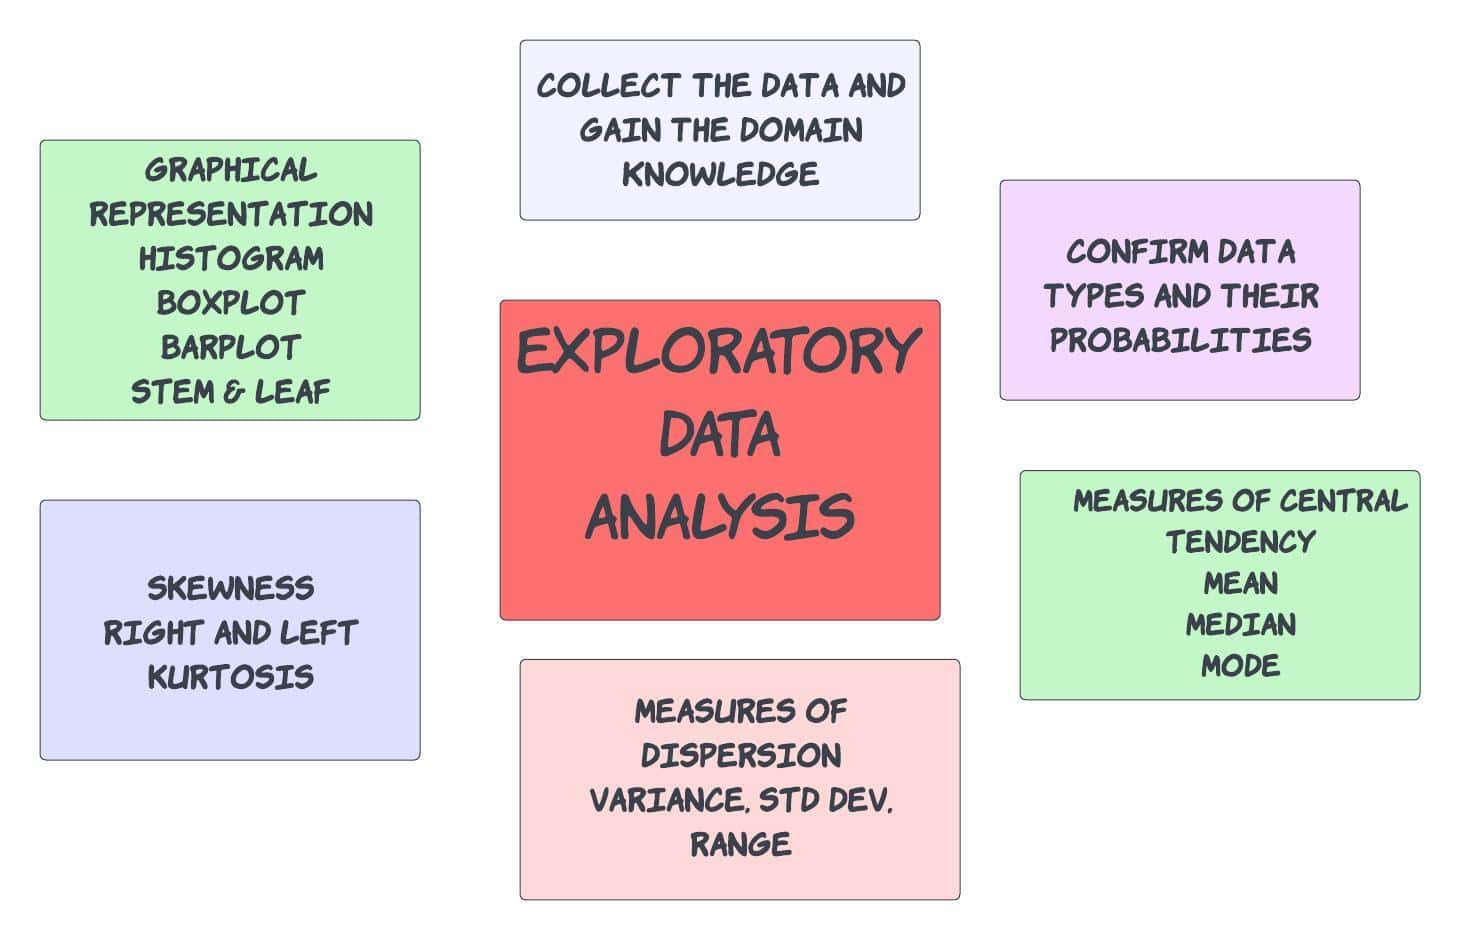
Explanatory data analysis, also known as exploratory data analysis (EDA). This step is a crucial initial step in the data analysis process. It involves examining and visualizing the data to gain insights, understand the patterns, and identify relationships between variables. The primary objective of EDA is to discover the underlying structure of the data and generate hypotheses for further research.
During explanatory data analysis, data scientists use statistical and graphical techniques to summarize and explore the data.
Explanatory data analysis helps data scientists gain a better understanding of the data’s characteristics, identify potential issues or biases, and generate hypotheses for subsequent modeling and analysis steps. It plays a crucial role in guiding the direction of data-driven projects and forming the basis for more advanced analysis techniques.
3.5. Data Modeling
Data modeling is the process of creating a conceptual representation of data and its relationships within a specific domain. It involves designing a structured and organized representation of data to facilitate understanding, analysis, and efficient storage and retrieval of information. Data modeling serves as a blueprint for developing databases, data warehouses, or data systems:
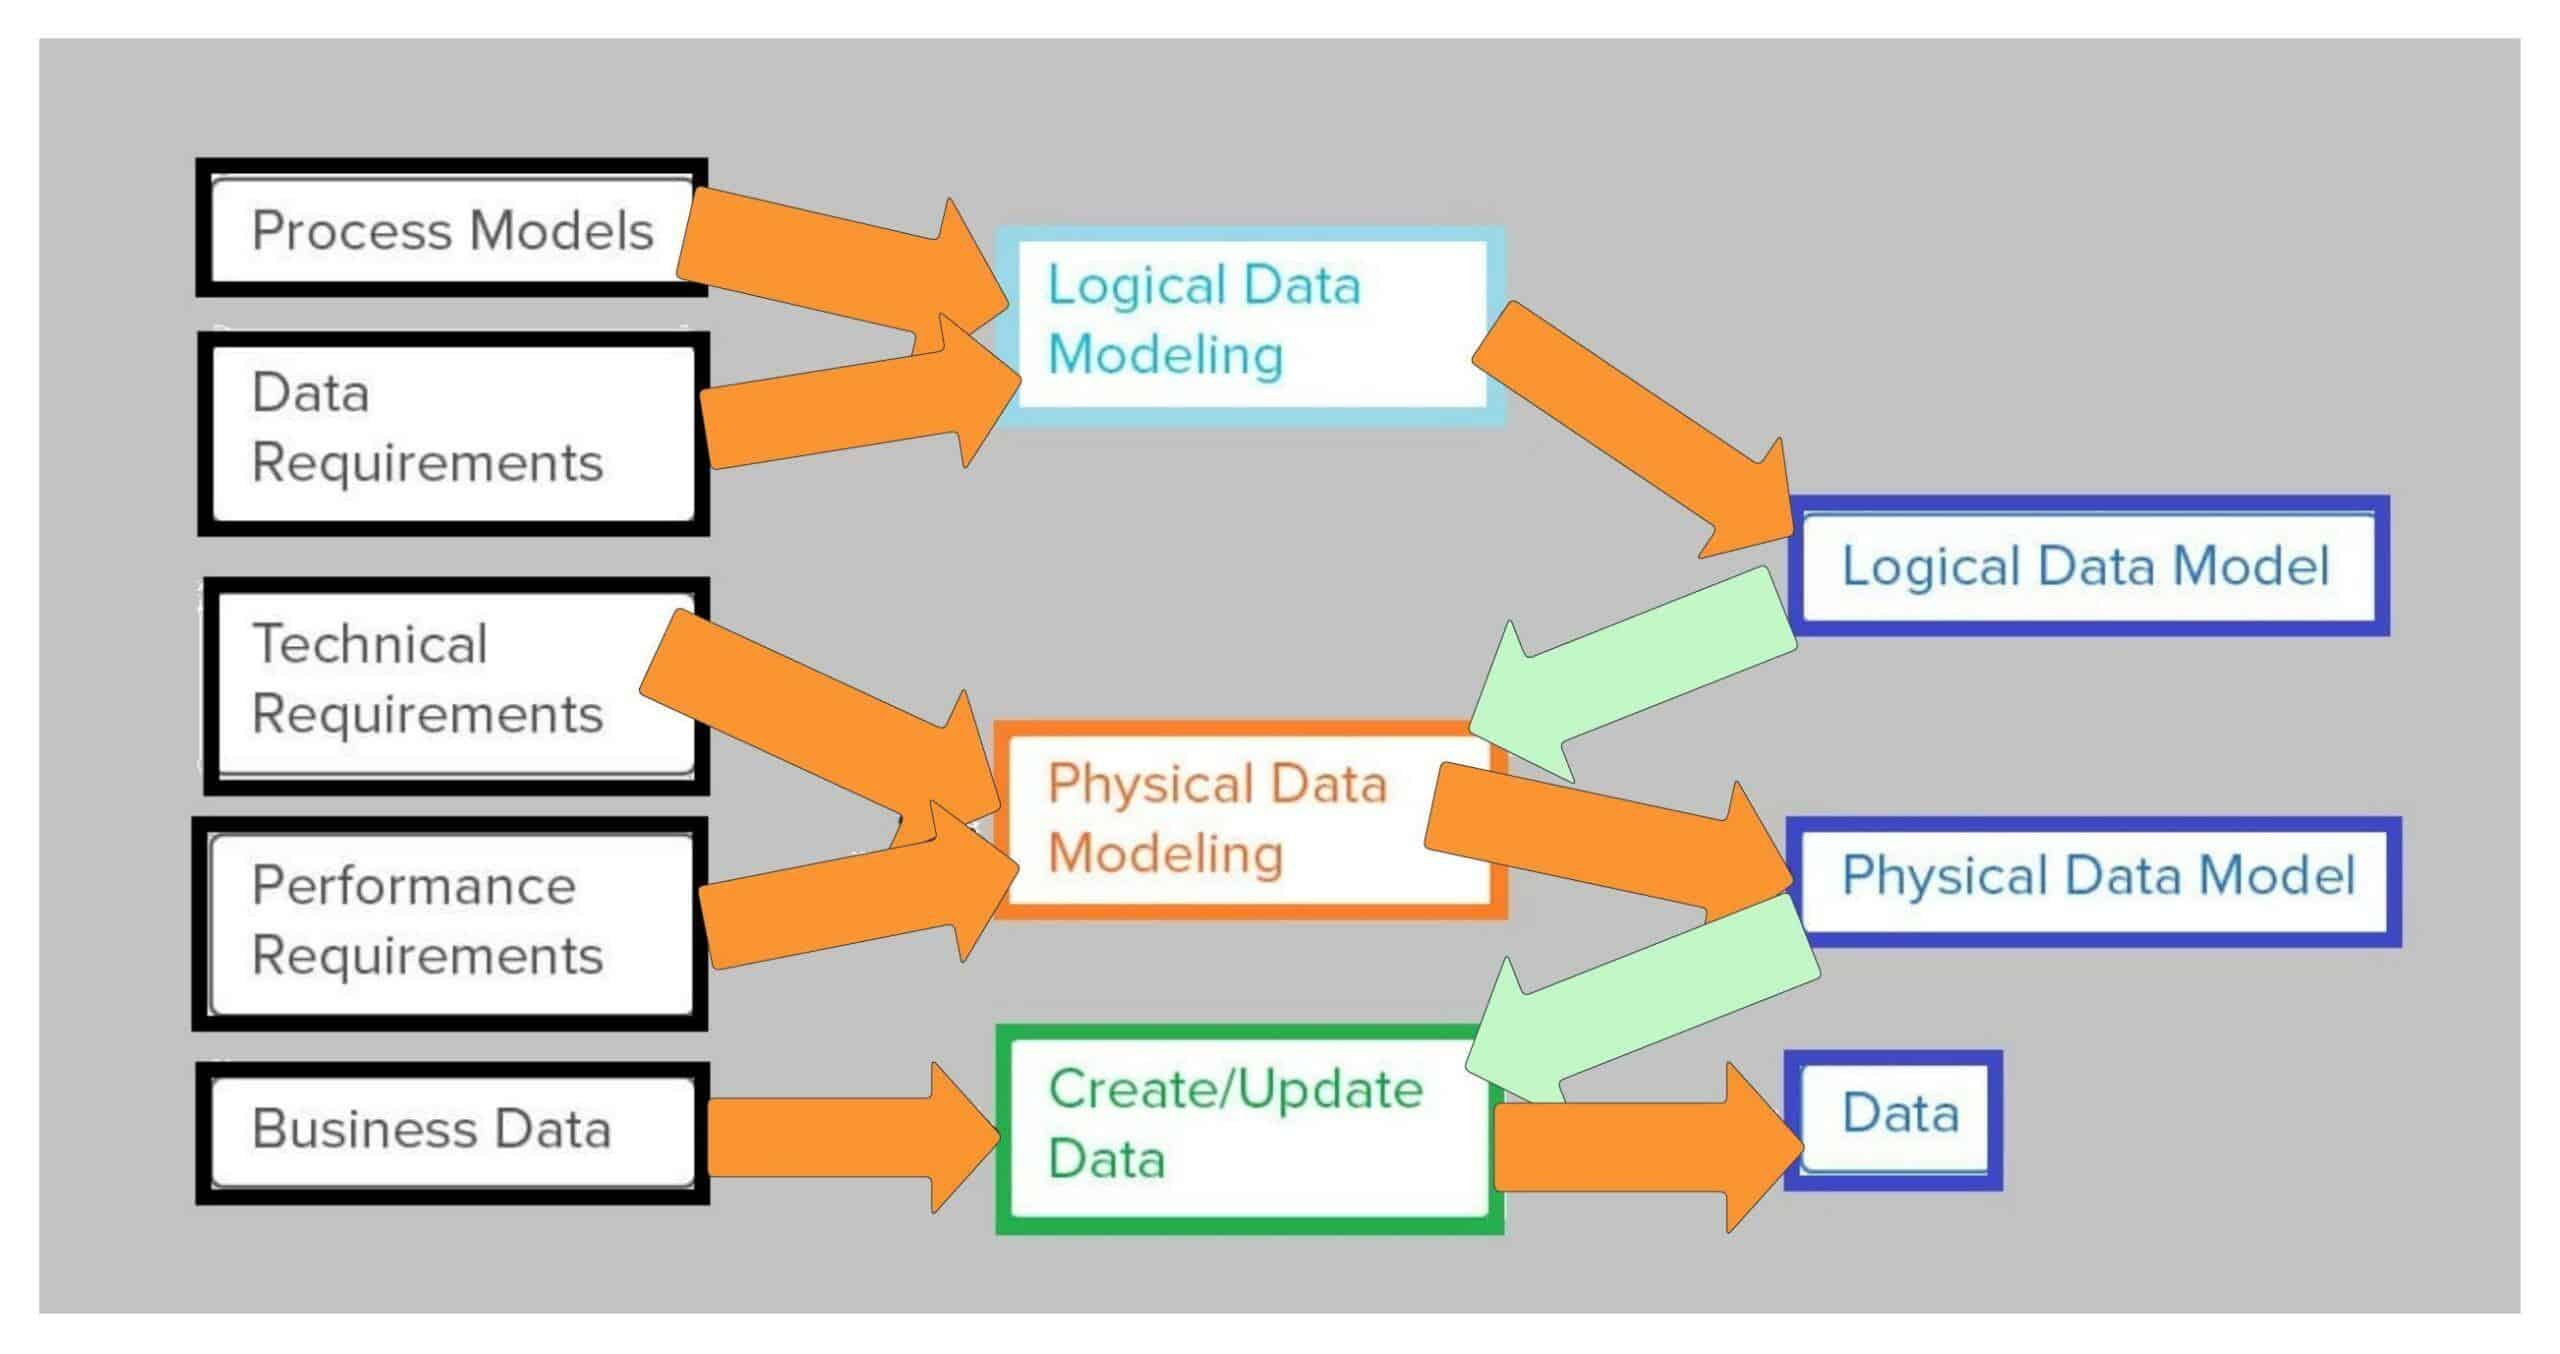
Data modelling ensures data integrity, consistency, and accuracy in database systems. It helps organise and structure data in a way that aligns with the business requirements and enables efficient data storage, retrieval, and manipulation. The resulting data model is a foundation for database design, development, and implementation in various applications and systems.
3.6. Data Visualization
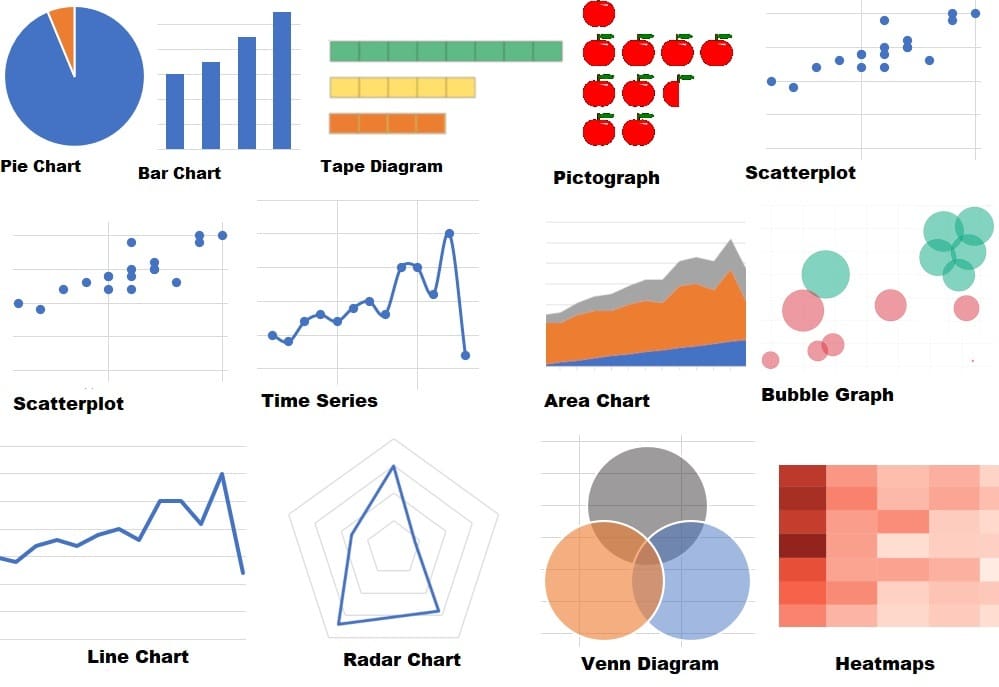
Data visualization is the graphical representation of data and information using visual elements such as charts, graphs, maps, or interactive visualizations. This step involves transforming raw data into visual representations that are easy to understand, interpret, and communicate:
Here’re some key aspects of data visualization:
- Visual Representation: Choosing appropriate visual elements to represent the data effectively. This can include bar charts, line charts, scatter plots, pie charts, heatmaps, treemaps, network diagrams, geospatial maps, or interactive visualizations
- Data Mapping: Mapping the data attributes to visual properties such as position, length, angle, size, colour, or shape. This helps convey information and patterns in the data. For example, mapping a numeric value to the height of a bar in a bar chart or mapping different categories to different colours in a pie chart
- Exploration and Analysis: Using visualizations to explore and analyze the data, identify patterns, trends, or relationships, and gain insights. Visualizations can reveal hidden patterns, outliers, or correlations that may not be apparent in raw data alone
- Communication and Storytelling: Using visualizations to effectively communicate findings, insights, and narratives to a wider audience. Well-designed visualizations can make complex data more accessible, engaging, and understandable, enabling stakeholders to grasp and interpret information more easily
- Interactive Visualizations: Creating interactive visualizations allows users to explore the data dynamically and interact with the visual elements. Interactive features such as zooming, filtering, sorting, or tooltips provide a more engaging and customized experience for users to interact with the data
- Dashboards and Infographics: Designing data dashboards or infographics that combine multiple visualizations and data summaries to provide a comprehensive overview of complex information. Dashboards and infographics enable users to get a holistic view of the data and make data-driven decisions efficiently
- Design Principles: Applying design principles such as colour theory, typography, layout, and visual hierarchy to create visually appealing and effective visualizations. Design choices influence the readability, clarity, and impact of the visualizations
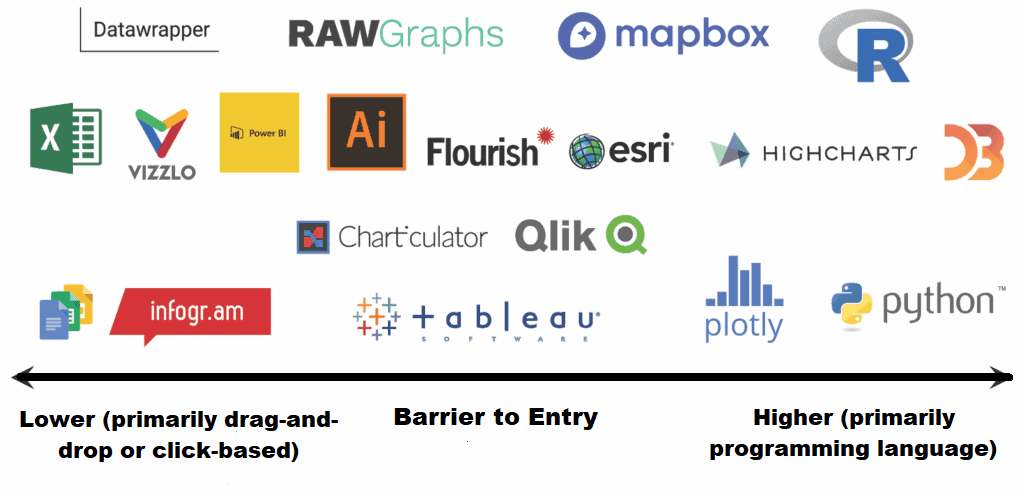
Popular tools that are used in data visualization are shown in the following figure. These tools were classified according to ease of use and the programming language skills necessary:
Data visualization plays a crucial role in data analysis, exploratory data analysis (EDA), data storytelling, and decision-making processes. It helps communicate insights, patterns, and trends in a more accessible and impactful way, enabling data-driven storytelling and enhancing data-driven decision-making processes.
3.7. Data Deployment
Data deployment refers to the process of implementing and integrating data-driven models, algorithms, or insights into operational systems or decision-making processes. It involves putting the results of data analysis or machine learning models into practical use within an organization or application.
Some key aspects of data deployment includes of model implementation, system integration, automation and scalability, monitoring and maintenance, security and privacy, documentation and support.
Data deployment is a crucial phase in the data science lifecycle as it bridges the gap between data analysis and real-world applications. Successful data deployment ensures that the benefits of data-driven solutions are realized, leading to improved decision-making, enhanced operational efficiency, and valuable business outcomes.
3.8. Data Maintenance
Data maintenance refers to the ongoing activities and processes involved in managing, updating, and ensuring the quality and integrity of data throughout its lifecycle. It involves various tasks and practices to preserve the accuracy, consistency, and usability of data over time.
Key aspects of data maintenance contain data quality monitoring, data updates, data archiving, data security, data backup and recovery, metadata management, data retention and deletion.
Data maintenance ensures data reliability, consistency, and usability over time. By actively managing and maintaining data, organizations can rely on accurate and up-to-date information for decision-making, reporting, analysis, and other data-driven activities.
4. Data Science Use Cases
Data science has a wide range of use cases across various industries. The versatility of data science allows it to be adapted to address specific challenges and opportunities in almost any domain where data is available. Here’re some common examples:
- Fraud detection: Data science can be used to develop models that detect fraudulent activities, such as credit card fraud, insurance fraud, or identity theft. By analyzing patterns and anomalies in transaction data, data scientists can build algorithms that flag suspicious activities and help prevent financial losses
- Recommendation systems: Many online platforms, such as e-commerce websites, streaming services, and social media platforms, use recommendation systems powered by data science. These systems analyze user behaviour, preferences, and historical data to suggest personalized recommendations, products, or content
- Healthcare analytics: Data science plays a crucial role in healthcare by analyzing electronic health records, medical imaging data, genomic data, and other healthcare-related data sources. It can be used for disease diagnosis, treatment prediction, patient monitoring, drug discovery, and optimizing healthcare operations
- Natural language processing (NLP): NLP techniques are used in various applications, such as sentiment analysis, chatbots, language translation, text summarization, and information extraction. Data science enables machines to understand and generate human language, improving communication and automation in numerous industries
- Image and video analysis: Data science techniques, including computer vision and deep learning, are employed for image and video analysis tasks. Applications range from facial recognition, object detection, and autonomous vehicles to surveillance systems, quality control, and medical imaging analysis
- Predictive maintenance: Data science enables predictive maintenance by analyzing sensor data, equipment logs, and historical maintenance records. By applying machine learning algorithms, organizations can predict when machines or components are likely to fail or require maintenance, enabling proactive maintenance and reducing downtime
- Energy optimization: Data science is applied in energy management to optimize energy consumption, reduce costs, and improve sustainability. It involves analyzing energy usage patterns, weather data, and building characteristics to identify opportunities for energy efficiency improvements
- Demand forecasting: Retailers and supply chain companies leverage data science to forecast product demand accurately. By analyzing historical sales data, market trends, weather patterns, and other relevant factors, organizations can make informed decisions regarding inventory management, production planning, and pricing strategies
- Customer churn prediction: By analyzing customer behavior, usage patterns, and historical data, data science can help identify customers who are likely to churn or discontinue using a product or service. This enables organizations to take proactive measures to retain customers through targeted marketing campaigns or improved customer experiences
- Social media analytics: Data science techniques can be useful for extracting valuable insights from social media data, including sentiment analysis, topic modelling, trend detection, and influencer identification. Organizations use these insights to understand customer opinions, track brand reputation, and tailor marketing strategies
These are just a few examples. However, data science has numerous other applications in fields such as finance, transportation, manufacturing, sports analytics, environmental monitoring, and more.
5. Conclusion
Data science has applications in various industries and domains, including finance, healthcare, marketing, social sciences, cybersecurity, etc. It’s crucial in gaining a competitive advantage in today’s data-driven world.
In this tutorial, we started with the definition of data science. Then, we discovered different aspects of data science.