

Yes, we're now running our only Summer Sale. All Courses are 30% off until 20th July, 2026:
How to Return a Pivot Table Output in SQL?
Last updated: September 23, 2025
Learn through the super-clean Baeldung Pro experience:
>> Membership and Baeldung Pro.
No ads, dark-mode and 6 months free of IntelliJ Idea Ultimate to start with.
1. Introduction
In data analysis and reporting, pivoting data has become a common requirement for organizing our results in a clear and meaningful way.
However, achieving this in SQL isn’t always straightforward. Unlike spreadsheet tools that offer drag-and-drop pivoting, SQL lacks a universal pivot function across databases, leaving us to navigate between different and sometimes complex approaches depending on the database in use.
In this tutorial, we address that challenge by showing how to return pivot table outputs using SQL easily. We’ll walk through various methods based on different SQL dialects, along with best practices and performance tips to help us write efficient and effective pivot queries.
2. What Is a Pivot Table?
A pivot table is a method that allows us to reorganize and summarize data, making it easier to analyze. It often involves transforming rows into columns and applying aggregate functions, such as SUM, COUNT, and AVG, to group data in a more digestible format.
With this structure, it becomes useful for us in generating reports, comparing values across categories, and spotting trends.
3. SQL Approaches to Pivoting
As previously established, there is no one-size-fits-all approach to pivoting for different Relational Database Management Systems (RDBMs), such as SQL Server, PostgreSQL, or MySQL.
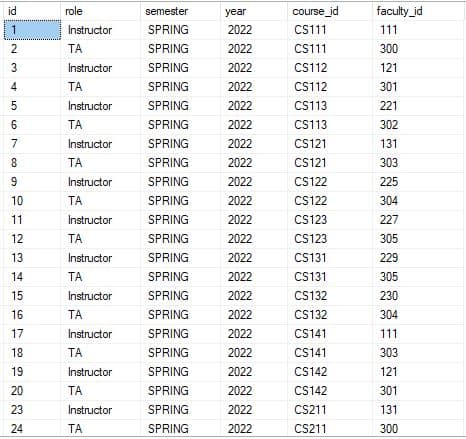
To put this into practice, we’ll use the Teaching table from the Baeldung University database schema:

The Teaching table records faculty roles (Instructor or TA) for each course offering, along with the semester, year, course_id, and faculty_id:
Suppose we want to answer the question: How many Instructors and TAs were assigned in each semester?
To answer this, we can create a pivot table where each row represents a role, each column represents a semester, and the cell values indicate the number of times each role appears in each semester.
3.1. In SQL Server
Here, we can use the built-in PIVOT operator to transform rows into columns:
SELECT [role],
        [SPRING] AS spring_count,
        [FALL] as fall_count
FROM (
	SELECT [role], semester
	FROM Teaching
	) AS source
PIVOT (
	COUNT(semester)
	FOR semester IN ([SPRING], [FALL])
	) AS pivot_table;
The inner query selects just the role and semester columns from the Teaching table. Next, the PIVOT section applies the COUNT (semester) aggregation, then transforms unique semester values into columns.
Finally, the code returns the result:
+------------+--------------+-------------+
| role       | spring_count | fall_count  |
+------------+--------------+-------------+
| Instructor |          176 |         130 |
| TA         |          154 |         152 |
+------------+--------------+-------------+
Our pivot table shows us the distribution of TAs and Instructors in each semester – Spring and Fall.
3.2. In PostgreSQL
PostgreSQL lacks a native PIVOT operator; however, it offers similar functionality through the crosstab() function, which is provided by the tablefunc extension. The tablefunc extension is valuable to us because it gives access to functions such as crosstab() and connectby() for advanced table transformations.
First, we enable the extension (if it’s not enabled already):
CREATE EXTENSION IF NOT EXISTS tablefunc;This enables the crosstab() function in our PostgreSQL database.
Second, we use the function to pivot the data:
SELECT *
FROM crosstab(
	$$
	SELECT role, semester, COUNT(*)
	FROM Teaching
	GROUP BY role, semester
	ORDER BY role, semester
	$$,
	$$ VALUES ('SPRING'), ('FALL') $$
	) AS ct(role TEXT, spring_count INT, fall_count INT);
The query (inside the first delimiter – $$) returns rows in the form of (row_key, category, value) where:
- role is the row identifier
- semester provides the categories to become columns
- COUNT(*) gives the aggregated value per role and semester
The following query (within the second $$) defines the exact column values (i.e., the semesters) in the desired order. Finally, the last line of the code block declares the output columns and their data types:
+------------+--------------+-------------+
| role       | spring_count | fall_count  |
+------------+--------------+-------------+
| Instructor |          176 |         130 |
| TA         |          154 |         152 |
+------------+--------------+-------------+
The results shown are similar to those for SQL Server, which confirms our accuracy.
3.3. In MySQL
Similar to PostgreSQL, MySQL does not have a built-in PIVOT operator or a direct crosstab() equivalent. However, all hope is not lost as we can manually simulate pivoting using the COUNT aggregate function and the CASE WHEN + GROUP BY pair:
SELECT
    role,
    COUNT(CASE WHEN semester = 'SPRING' THEN 1 END) AS spring_count,
    COUNT(CASE WHEN semester = 'FALL' THEN 1 END) AS fall_count
FROM teaching
GROUP BY role;
With this approach for MySQL, we have our results as expected:
+------------+--------------+-------------+
| role       | spring_count | fall_count  |
+------------+--------------+-------------+
| Instructor |          176 |         130 |
| TA         |          154 |         152 |
+------------+--------------+-------------+
The results across the three SQL dialects produce the same distribution and answer our question.
4. Dynamic Pivoting
Let’s say the university starts offering more semesters in addition to Spring and Fall, such as Summer or Winter.
Rather than manually updating our SQL query every time a new semester appears, we can create a dynamic pivot query that automatically adapts to changes. Let’s insert some new data into the table to test this out:
INSERT INTO Teaching (id, role, semester, year, course_id, faculty_id)
VALUES
(613, 'Instructor', 'SUMMER', 2023, 'CS111', 111),
(614, 'TA',         'SUMMER', 2023, 'CS111', 300),
(615, 'Instructor', 'SUMMER', 2023, 'CS112', 121),
(616, 'TA',         'SUMMER', 2023, 'CS112', 301);

INSERT INTO Teaching (id, role, semester, year, course_id, faculty_id)
VALUES
(617, 'Instructor', 'WINTER', 2023, 'CS113', 221),
(618, 'TA',         'WINTER', 2023, 'CS113', 302),
(619, 'Instructor', 'WINTER', 2023, 'CS121', 131);
Now, let’s apply dynamic pivoting.
4.1. SQL Server
Dynamic SQL is supported in SQL Server via the EXEC() and sp_executesql command, both used to build and run a pivot query where the column headers are generated on the go:
DECLARE @columns NVARCHAR(MAX), @sql NVARCHAR(MAX);
SELECT @columns = STRING_AGG(QUOTENAME(semester), ', ')
FROM (SELECT DISTINCT semester FROM Teaching) AS semesters;
SET @sql = '
    SELECT role, ' + @columns + '
    FROM (
        SELECT role, semester
        FROM Teaching) AS source
    PIVOT (
        COUNT(semester)
        FOR semester IN (' + @columns + ')) AS pivot_table;
          ';
EXEC sp_executesql @sql;
First, we collect distinct semester values dynamically using STRING_AGG and wrap them in brackets. Next, these are inserted into the PIVOT clause inside the dynamic SQL string (built from the SET @sql line).
Then the final pivoted query is executed at runtime using sp_executesql:
+------------+-------+--------+--------+--------+
| role       | FALL  | SPRING | SUMMER | WINTER |
+------------+-------+--------+--------+--------+
| Instructor |   130 |    176 |      2 |      2 |
| TA         |   152 |    154 |      2 |      1 |
+------------+-------+--------+--------+--------+
Our dynamic query produces the expected results since we’ve updated our table.
4.2. PostgreSQL
PostgreSQL doesn’t support dynamic SQL in plain queries the way SQL Server does, but we can achieve dynamic pivoting using PL/pgSQL with the help of EXECUTE:
DO $$
DECLARE
    cols TEXT;
    dyn_sql TEXT;
BEGIN
    SELECT string_agg(
        format('COALESCE(MAX(CASE WHEN semester = %L THEN count END), 0) AS "%s"', semester, semester),
        ', '
    ) INTO cols
    FROM (SELECT DISTINCT semester FROM Teaching) s;
    dyn_sql := format($f$
        SELECT role, %s
        FROM (
            SELECT role, semester, COUNT(*) AS count
            FROM Teaching
            GROUP BY role, semester
        ) AS sub
        GROUP BY role
        ORDER BY role;
    $f$, cols);
    RAISE NOTICE 'Run this SQL: %', dyn_sql;
END $$;
Our code dynamically generates a pivot query by first collecting all unique semester values from the Teaching table and then constructing a SELECT statement that utilizes CASE WHEN logic to count the number of times each role appears in each semester.
Next, it formats each semester as a separate column using the COALESCE(MAX(…)) section to ensure each cell returns a value or zero if none exists. The result is a complete pivot query string stored in the dyn_sql variable.
In PostgreSQL, instead of executing the query, it returns an output with a RAISE NOTICE, allowing us to run the generated SQL to view the pivoted table manually:
NOTICE: Run this SQL:
SELECT role,
       COALESCE(MAX(CASE WHEN semester = 'FALL' THEN count END), 0) AS "FALL",
       COALESCE(MAX(CASE WHEN semester = 'SPRING' THEN count END), 0) AS "SPRING",
       COALESCE(MAX(CASE WHEN semester = 'SUMMER' THEN count END), 0) AS "SUMMER",
       COALESCE(MAX(CASE WHEN semester = 'WINTER' THEN count END), 0) AS "WINTER"
FROM (
     SELECT role, semester, COUNT(*) AS count
     FROM Teaching GROUP BY role, semester
     ) AS sub
GROUP BY role
ORDER BY role;
DO
We can copy and paste the SQL code returned in our output into our code editor and hit run:
+------------+-------+--------+--------+--------+
| role       | FALL  | SPRING | SUMMER | WINTER |
+------------+-------+--------+--------+--------+
| Instructor |   130 |    176 |      2 |      2 |
| TA         |   152 |    154 |      2 |      1 |
+------------+-------+--------+--------+--------+
Our results are just as expected.
4.3. MySQL
Again, MySQL does not support true dynamic pivoting in a single query. Still, we can arrive at similar results using a prepared statement (via PREPARE/EXECUTE) and dynamic SQL generation with GROUP_CONCAT:
SET @sql = NULL;
SELECT GROUP_CONCAT(DISTINCT CONCAT(
      'COUNT(CASE WHEN semester = ''', semester, ''' THEN 1 END) AS `', semester,'`'))
INTO @sql
FROM Teaching;
SET @sql = CONCAT('SELECT role, ', @sql, '
                   FROM Teaching
                   GROUP BY role');
PREPARE stmt FROM @sql;
EXECUTE stmt;
DEALLOCATE PREPARE stmt;
First, our script constructs a pivot query by building a comma-separated list of CASE WHEN expressions, one for each unique semester, that count the number of times each role appears per semester.
Second, it stores these expressions in a variable @sql and then combines them into a complete SELECT statement grouped by role.
Finally, it prepares and executes the query using PREPARE and EXECUTE, allowing the pivot to adjust automatically as new semesters are added to the data:
+------------+-------+--------+--------+--------+
| role       | FALL  | SPRING | SUMMER | WINTER |
+------------+-------+--------+--------+--------+
| Instructor |   130 |    176 |      2 |      2 |
| TA         |   152 |    154 |      2 |      1 |
+------------+-------+--------+--------+--------+
All outputs return similar results for the SQL dialects.
5. Best Practices and Performance Considerations
So far, we have discussed several methods for creating a pivot table; therefore, we need to consider and apply practices that can improve clarity, performance, and maintainability.
5.1. Consider Readability and Maintainability
We need to strive for clarity when writing our pivot queries. While PIVOT or crosstab() might reduce lines of code, a well-structured CASE WHEN query can be easier to understand and debug, especially for teams working across database platforms.
Furthermore, when queries get complex, use Common Table Expressions (CTEs) to separate transformation steps (like filtering, aggregation, and pivoting). With this modular structure, we can improve readability and allow each step to be tested independently.
5.2. Optimize for Performance
Because pivot operations often include grouping, aggregation, and conditional logic, these can be expensive on large datasets. Hence, we can consider:
- Indexing relevant columns like role, semester, or course_id
- Applying filters early to reduce the working dataset before pivoting
- Using materialized views or caching for frequently used pivot results
Additionally, we can test query plans with EXPLAIN or EXPLAIN ANALYZE to ensure our pivot query is performing efficiently.
5.3. Handle Nulls and Missing Data Gracefully
Pivoting can result in sparse data, where some combinations don’t exist. We can account for this using functions like COALESCE() to replace nulls with zeros or placeholders so our reports remain accurate and consistent.
5.4. Use CASE WHEN as a Portable Pivoting Tool
The CASE WHEN + GROUP BY method is a SQL standard and works across all major database systems, including MySQL, SQL Server, PostgreSQL, SQLite, Oracle, etc. The combination becomes especially useful:
- For cross-database compatibility
- Working with a small number of known pivot columns
- When we need to prioritize transparency over brevity
That said, on the other hand, we need to consider built-in functions when working with many columns or when dynamic behavior is needed and supported by our chosen dialect.
6. Conclusion
In this article, we acknowledged the difficulties associated with pivoting data in SQL compared to spreadsheets. We then proceeded to explore diverse solutions to this challenge via different SQL dialects as well as how to achieve dynamic pivoting for variable data values.
Finally, we identified several practices to bear in mind to maximize the benefits of our pivot queries and improve performance.