

Yes, we're now running our only Summer Sale. All Courses are 30% off until 20th July, 2026:
Checking RabbitMQ Queues in the Management Console
Last updated: January 6, 2025
Learn through the super-clean Baeldung Pro experience:
>> Membership and Baeldung Pro.
No ads, dark-mode and 6 months free of IntelliJ Idea Ultimate to start with.
1. Overview
When working with RabbitMQ message queues, monitoring queue state and message flow is crucial for understanding system behavior.
In this tutorial, we’ll learn how to use the RabbitMQ management console tool to monitor queue statistics. Additionally, we’ll explore how the automatic acknowledgment mode and prefetch mechanism give us misleading pending message counts for our queue.
2. Setting up RabbitMQ
Let’s start by setting up RabbitMQ to demonstrate the different monitoring tools. Specifically, we can start a RabbitMQ Docker container using the command docker run:
$ docker run -d --name rabbitmq \
    -p 5672:5672 \
    -p 15672:15672 \
    rabbitmq:3.13.7-management
91002cd436168bcee734f784f80c28ec09ee480635be88167264089af947cf4c
The command above executes docker run to create and start a Docker container with the rabbitmq:3.13.7-management image. The management suffix indicates that we’re running a RabbitMQ container that also exposes the management console for our monitoring purposes.
2.1. Creating a Queue
Next, we create a queue using the rabbitmqadmin command within the Docker container. To do that, we can use the docker exec command to run the rabbitmqadmin declare queue command to create a queue in our RabbitMQ server:
$ docker exec rabbitmq rabbitmqadmin declare queue name=test_queue
queue declared
The command above creates a queue and names it test_queue.
2.2. Publishing Messages
To make the subsequent demonstration more insightful, we’ll use the rabbitmqadmin command to publish some test messages to the queue we’ve just created:
$ for i in {1..5}; do
    docker exec rabbitmq rabbitmqadmin publish \
        exchange=amq.default \
        routing_key=test_queue \
        payload="test message $i"
done
Message published
Message published
Message published
Message published
Message published
The script above uses the rabbitmqadmin publish command to publish messages to the test_queue. Additionally, we repeat the command five times using the for loop to publish five messages into the queue.
3. RabbitMQ Management Console
The RabbitMQ management console is a graphical user interface (GUI) monitoring tool for managing the RabbitMQ instance. Specifically, it provides insight into the different components of our RabbitMQ instance, including the number of active consumers, the message publication and consumption rate, and the queue statistics.
To access the RabbitMQ management console, we can visit the instance’s hostname at the default port 15672. For example, we’ve mapped port 15672 of the RabbitMQ Docker container to the same port on the local network stack. Therefore, we can access the management console through http://localhost:15672:
Unless overridden with the environment variables, the RabbitMQ management console has a default username guest and a default password guest.
3.1. Overview Page
Once we’re logged in, we’ll land on the Overview page of the console:
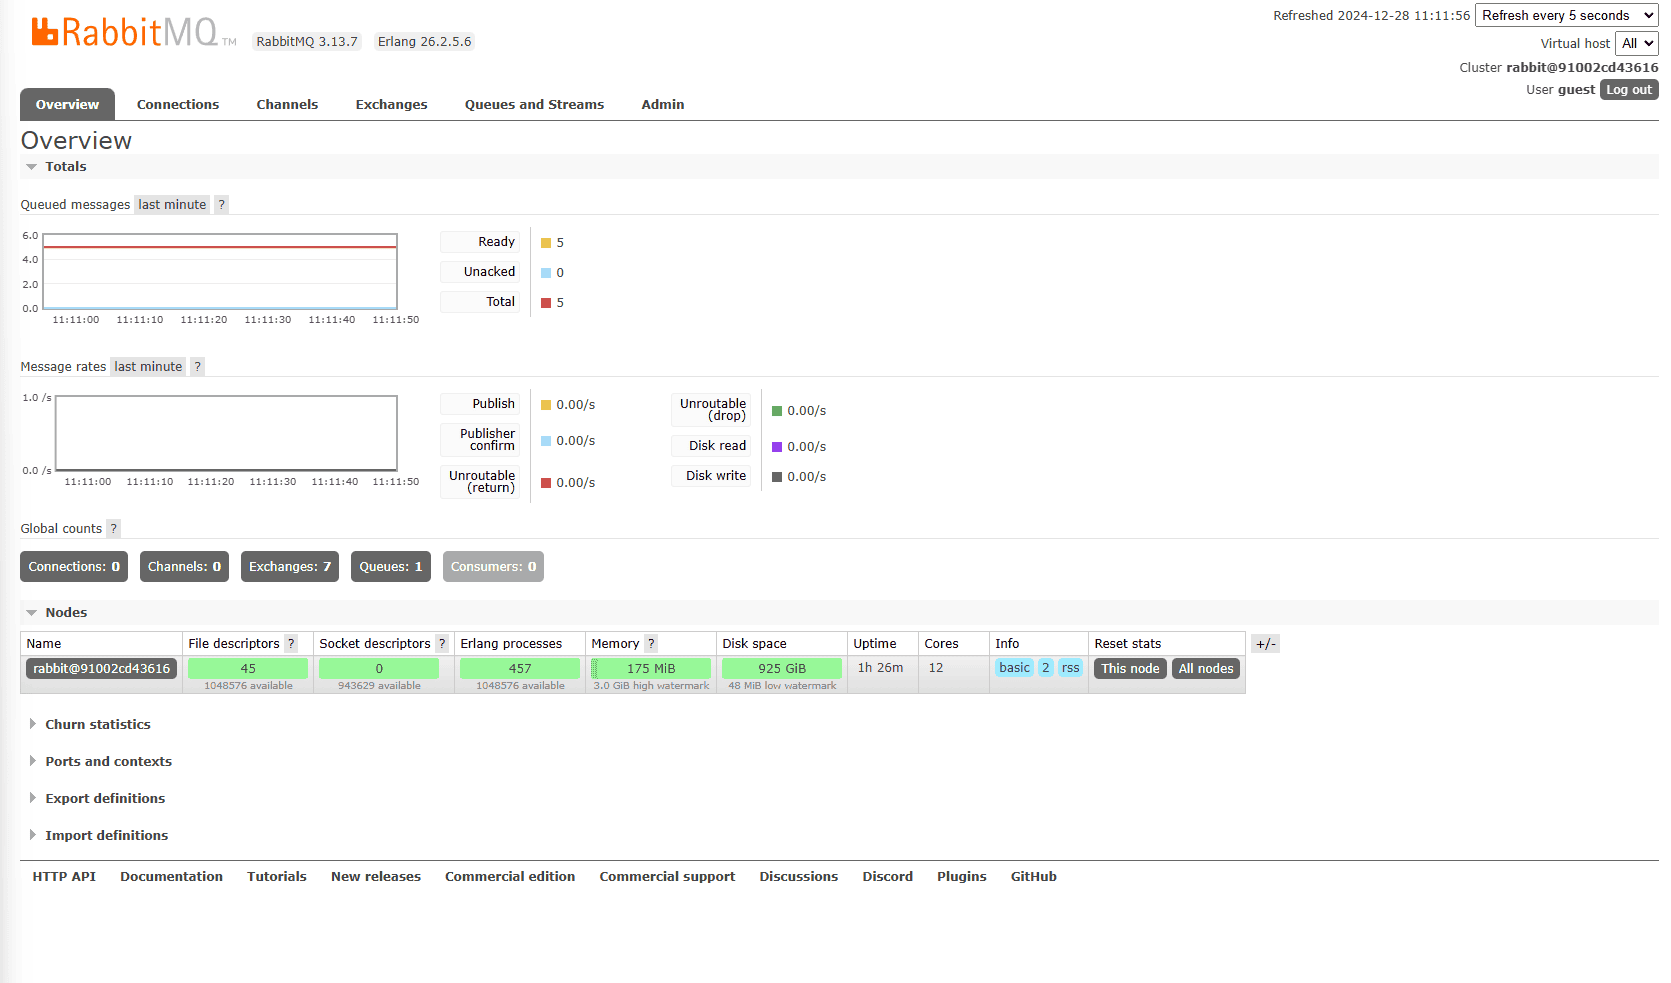
The Overview page contains two main graphs, Queued messages, and Message rates. The Queued messages graph at the top shows the total messages across all the queues in the RabbitMQ instance. Within the graph, we can see that it breaks down the messages in the queues into those that are ready for delivery and those that are delivered but pending consumers’ acknowledgment.
Then, the Message rates graph shows the rate of message publications. Specifically, it tells us the number of messages that are being published per second at the last minute.
Below the graphs, we can see the number of connections, channels, exchanges, queues, and consumers in our instance.
The statistics on the Overview page aim to provide a high-level overview of the status of our RabbitMQ instance and are usually not too insightful on their own. To see a finer breakdown, we can go to the respective page of the components we’re interested in.
3.2. Queues and Streams
To see a breakdown of details related to queues, we can head to the Queues and Streams page:

The main section of the Queues and Streams page lists all the queues in our RabbitMQ instance. Then, each row in the table shows three groups of information for each queue in the instance. Firstly, the overview section shows the name, type, and queue’s state. Then, the second group of columns shows the number of messages in the queue and their states.
Finally, the last group of columns shows the rate of message movement in the queue. Specifically, it shows the rate of the messages coming into the queue, and the rate of the messages being delivered and acknowledged by the consumers.
The message rates columns provide great insight that helps us allocate our resources. Specifically, we can tell when a consumer struggles to catch up to the message publication when the incoming message rate exceeds the delivery and acknowledgment rate. When that happens, we can increase the number of consumers to speed up the processing.
4. Misleading Pending Message Counts
When monitoring RabbitMQ queues, we might see discrepancies between what we expect and what the monitoring tools show us. Specifically, the pending message counts shown in the monitoring tools may not accurately reflect the actual messages that are pending to be processed. This is commonly caused by the prefetch mechanism and automatic message acknowledgment mode.
4.1. Prefetch Count
The prefetch count controls how many messages a consumer will prefetch and store in the internal queue when requesting messages from the RabbitMQ server. The prefetch mechanism is an optimization technique that greatly reduces the amount of network calls a consumer needs to make to the server to get the messages.
For example, instead of making 50 round-trip network calls to the server to get 50 messages, the consumer can define the prefetch count as 50 to get up to 50 messages in one request.
4.2. Message Acknowledgement Mode
There are two message acknowledgment modes in RabbitMQ: automatic and manual. In automatic message acknowledgment mode, the message is considered to be successfully delivered when the server successfully writes the payload into the TCP socket. If the consumer connection or channel is closed before the payload is delivered, the message is considered lost. Semantically, the automatic acknowledgment mode is similar to “fire-and-forget“, in which the failure to process the messages on the consumer side doesn’t constitute a delivery failure.
On the other hand, the manual message acknowledgment mode requires the consumer to send back an ACK after it has processed the message before the RabbitMQ instance records the message as successfully delivered. After the delivery and before it receives the ACK from the consumer, RabbitMQ parks the message under the “Unacked” messages as we’ve seen in the management console. When no ACK has been received after a certain period as defined by the visibility timeout, RabbitMQ will move the message back to the ready state again.
4.3. Prefetching and Automatic Acknowledgement
When our consumer uses an automatic acknowledgment mode with a large prefetching count, the pending message counts we’re seeing in the monitoring tool might be misleading.
For example, let’s say we’ve published five messages to our test_queue without any active consumers. When we check the monitoring tool, we’ll see that the ready message count is five, which aligns with our expectations. Then, we start a single-threaded consumer that takes one minute to consume one message to consume from the queue. Importantly, we use the automatic acknowledgment mode and set its prefetch count to 10.
After we start the consumer, the ready and unack message counts will drop to zero almost instantly. This happens because, in an automatic acknowledgment mode, all the messages, including those prefetched, will be marked as successfully delivered as soon as the RabbitMQ server sends the messages to the consumers. Even though the messages are still sitting in the consumer’s internal buffer, from the RabbitMQ server perspective, those messages are delivered successfully.
5. Conclusion
In this article, we’ve learned about the GUI-based management console that offers an interactive monitoring experience for our RabbitMQ instance. Specifically, we’ve shown that the Queues and Streams page of the management tool shows us the details of every individual queue in the instance. Subsequently, we’ve learned about the prefetch mechanism and the message delivery acknowledgment mode setting in RabbitMQ. Finally, we’ve learned that our reading statistics can contradict our expectations when a consumer uses a high prefetch count combined with an automatic acknowledgment mode.