

1. Introduction
In this article, we’re going to investigate Foresight, a new monitoring tool from Thundra designed to allow us to monitor our CI pipelines across our software repositories.
2. What Is Foresight?
Foresight is a tool that gives us greater insight into our CI pipelines and software tests. Specifically, it allows us to see the performance of the CI pipelines and the test results and coverage levels of the tests running within the pipeline. This includes support for Change Impact Analysis, where we can see the changes in a pull request and correlate them to test runs and test coverage to show how they affect our builds.
Currently, this only supports GitHub Actions as the CI tool. This means we need to use GitHub to store our code. However, other services may be supported in the future. Additionally, it supports a specific set of test tool output formats, including but not limited to JUnit and JaCoCo.
3. Adding Foresight to Our Project.
Before introducing Foresight into our projects, we will need our GitHub repositories already set up. Further, these will need a GitHub Actions pipeline already configured.
Firstly we need to create an account. We do this by visiting https://app.runforesight.com/signup and filling in the form:

Once we’re logged in, we’re ready to set up our first build. This is done by pressing the “Connect Pipeline” button:
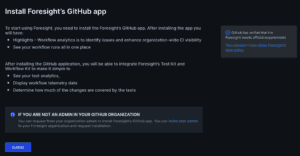
If we haven’t already done so, we’ll now see a prompt to set up the Foresight GitHub app in our account. Simply press the “Install” button on the following screen and follow the prompts:
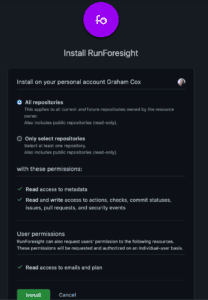
Once we return to the Foresight page from GitHub, we’ll have a prompt to decide if we want Foresight to monitor all repositories or if we want to select exactly which ones are monitored:
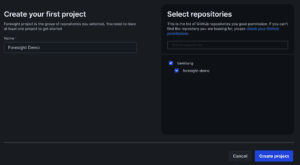
Finally, we’ll be at a point where we can create our first Foresight project. On this screen, we need to give the project a name and select which repositories it includes. This needs to be at least 1 repository but can be as many as necessary:
Next, Foresight will prompt us to configure the appropriate steps in our GitHub Actions. We’ll skip this for now and come back to it soon.
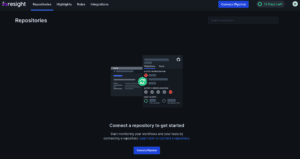
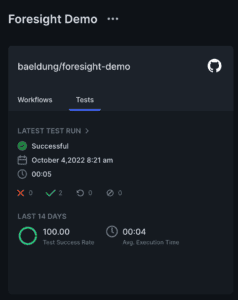
Now we have Foresight configured to monitor our project. Foresight will give us an easy dashboard showing the status of the repositories at a glance:
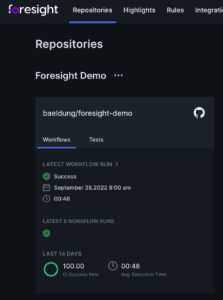
This gives us a quick overview of the project status, showing us the repositories that are part of it and the current status of those repositories. At this point, we don’t get much more than can already be obtained from GitHub itself, but it collects the details in one place to see them quickly and easily. This is especially useful if we have many repositories spanning different projects.
4. Integrating Foresight into CI Pipelines.
So far, we have connected Foresight to GitHub, allowing it to report on the status of our repositories. But this is only scratching the surface of what we can achieve. Foresight can integrate much deeper into our CI pipelines and thus report on much more than we have seen.
Doing this will give us visibility of the entire workflow run and the results of our tests and see how they change over time.
To start with, we need to visit the Foresight page for “Integrate your tests”:

Here we will see, amongst other things, the API Key that we need for this project:
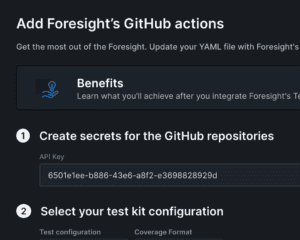
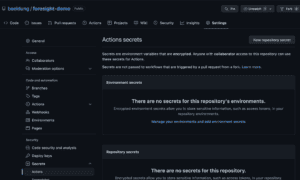
We’re going to take this and use it in our repository. Firstly we need to create a repository secret on the Secrets page within our repository settings:
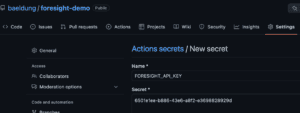
Here we can click the “New repository secret” button and create a new secret with the name FORESIGHT_API_KEY and the value from the Foresight page:
At this point, we’re ready to add the appropriate steps to our GitHub Actions pipelines. There are two of these to add.
The first step goes at the very start of every job in the repository:
- name: Collect Workflow Telemetry
  uses: runforesight/foresight-workflow-kit-action@v1
  if: success() || failure()
  with:
    api_key: ${{secrets.FORESIGHT_API_KEY}}
This will record telemetry about the workflow run, allowing us to see resource usage and how long each step takes.
The second step goes after we have run all of our tests in every job that is performing test runs:
- name: Analyze Test and/or Coverage Results
  uses: runforesight/foresight-test-kit-action@v1
  if: success() || failure()
  with:
    api_key: ${{secrets.FORESIGHT_API_KEY}}
    test_format: JUNIT
    test_framework: JUNIT
    test_path: target/surefire-reports
    coverage_format: JACOCO/XML
    coverage_path: target
The exact values here depend on our test runner and code coverage tools. These values work correctly for JUnit and JaCoCo in a single module build.
This will give us visibility into our tests. We can now see the results of test runs, which ones are successful and failing, and which ones are taking the longest to run. At this point, our dashboard will show us the test status of the last workflow run:
We also have access to more in-depth details about our workflows. This allows us to see exactly which steps were performed and how long they took – both in this run and in recent ones – to see which ones are costing the most time:

5. Troublesome Builds
Sometimes we have troublesome builds with slow and/or failing tests. Foresight helps us to see exactly where this is happening so that we can more easily improve things.
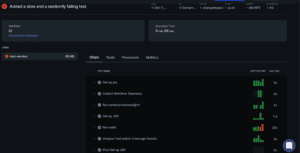
The Test Run Overview page for any given test run will show us not only an overview of the entire test run but also some details about where such problems may lie:
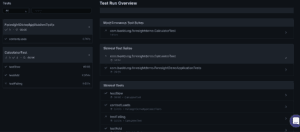
This shows us the test suites that were most problematic in this test run – the ones that had the most failures and took the longest to run. It also shows us the individual tests within those suites that took the longest to run. Here we can see that CalculatorTest had test failures and took a long time to run. Within this, we can see that testSlow took 8 seconds to finish. This immediately gives us places to look to improve things.
Clicking into a single test suite, we can see the same summary but only for this one suite instead of the entire project:
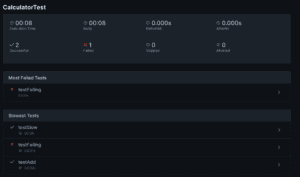
This lets us focus our attention on exactly one test suite and determine, within this suite, where we can best make improvements.
Further, clicking on one of the tests themselves will show us yet more information. If the test run failed, then it shows us why it failed:
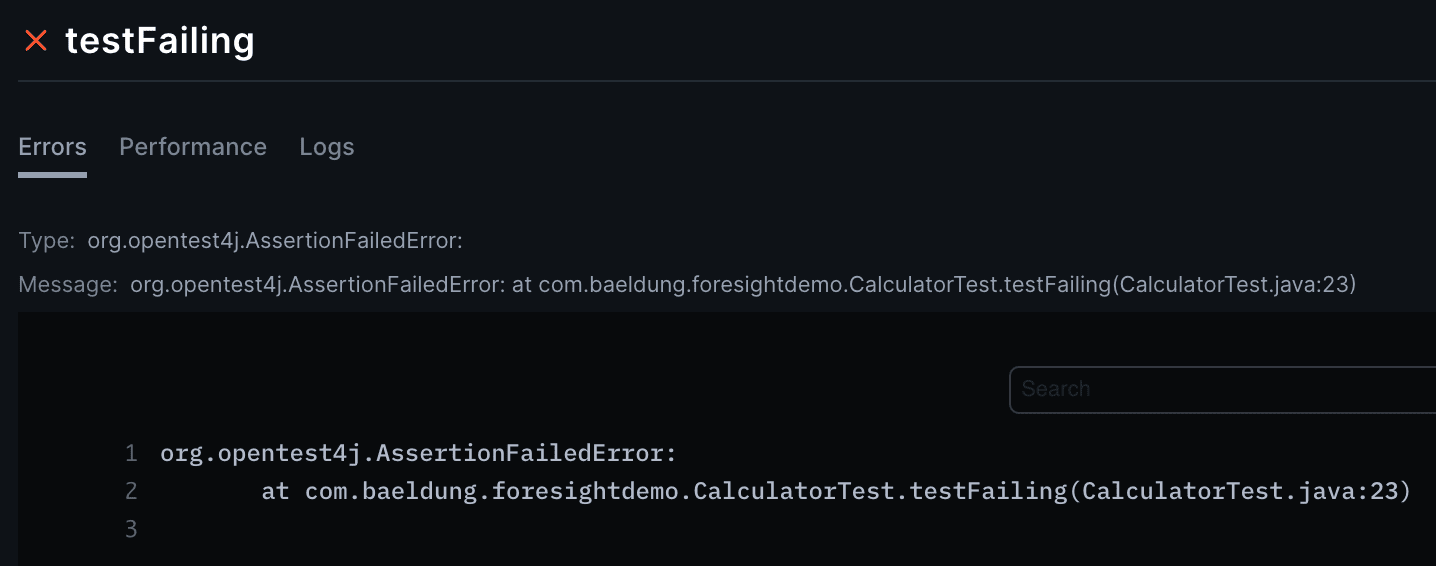
This is no different from what we would see if we ran the test ourselves within our IDE, but having access to this in Foresight can be incredibly convenient – especially if we’re investigating many errors in one place.
However, the really interesting area here is the past performance of the tests. The “Performance” tab on this screen shows us a summary of the past runs of this exact test. This shows us which runs were successful or failures, as well as how long each test run took:
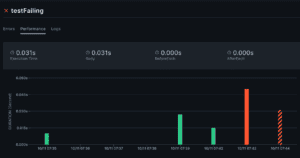
This will let us quickly determine exactly when the test started to be problematic. This in turn will allow us to narrow down what is causing the problems – something that could otherwise take significant effort.
6. Troublesome Workflows
In the same way that we can inspect individual test runs to determine where problems lie and more easily fix them, we also have the ability to do this for entire workflows. This lets us see where problems lie and where the time is taken across the entire workflow rather than just in the tests:
Here we can see for this workflow run the individual jobs that make it up and, for each of those jobs, the steps that compose it. We can also quickly see the time each step took, both for this run and for the last few runs. Finally, we can see which steps were successful and which failed. This quickly lets us narrow down exactly where problems lie so we can improve things.
If we’re trying to improve the speed of our CI builds, we can further click through to the “Processes” tab to see exactly what every step is doing and where the time is going:
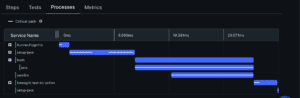
Here we can see that the “setup-java” and “bash” actions took the longest. Further, underneath the “bash” action, we can see that it was actually running “java” that took the time. Within that, we can see that it was “surefire” that took the majority of the time.
Finally, we can click through to the “Metrics” tab to see the resource usage of the server running the tests:
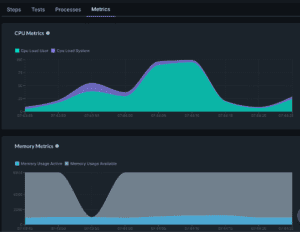
This lets us see the CPU, Memory, Network, and Disk usage throughout the run of the workflow. This can help to see exactly why it’s running slower than we would wish. Here we can see that the CPU usage spikes up high, which correlates to the time the Java build is running. From this, we can determine that we’re probably CPU bound – i.e., the build is busy doing things rather than waiting on other resources.
7. Change Impact Analysis
One of the more powerful features that Foresight offers is that of Change Impact Analysis. This gives us insight into the quality of changes within pull requests. Specifically, it lets us correlate the changes made with the test coverage to see where our changes are thoroughly tested and where they could benefit from additional coverage.
For this to work, it’s important that we’ve configured our GitHub Action to run for pull requests as well as pushes. We can do this by updating the on section:
on:
  push:
  pull_request:
    types:
      - opened
      - edited
      - reopened
      - synchronize
This has the effect that every time we open or update a pull request, we’ll run this workflow. which means that we’ll then upload the workflow data to Foresight.
This, in turn, means that when we look at the test details for our workflow run, we’ll have some additional information:
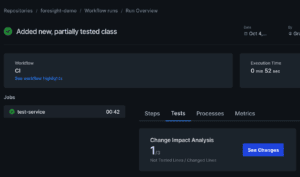
We can then click through and see the actual changes in this pull request and have the coverage details overlaid on them. This immediately gives us insight into which changes are adequately covered with tests:
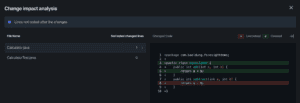
Here we can immediately see that we have changed two classes, one of which has added lines that don’t have adequate test coverage. This tells us that either the subtract method would benefit from additional test coverage or potentially that it’s unnecessary and we could remove it.
8. Summary
Here we have introduced Foresight as a tool to give increased visibility into our CI pipelines and to allow us to see better what is going on and where we can improve it. Why not try it in your projects and see what insights it can bring?