

Yes, we're now running our only Summer Sale. All Courses are 30% off until 20th July, 2026:
Real-Time Monitoring Using Apache HertzBeat
Last updated: August 12, 2025
Learn through the super-clean Baeldung Pro experience:
>> Membership and Baeldung Pro.
No ads, dark-mode and 6 months free of IntelliJ Idea Ultimate to start with.
1. Overview
As systems grow, the number of components increases. This creates more potential failure points across the infrastructure. As a result, it becomes critical to have a systematic approach to monitor a system. One option is to leverage a real-time monitoring system like Apache HertzBeat.
In this tutorial, we’ll learn about real-time monitoring using Apache HertzBeat and demonstrate a working example of monitoring a PostgreSQL database instance.
2. Introduction to Apache HertzBeat
Apache HertzBeat is an open-source, all-in-one monitoring platform, containing all the essential purpose-built components. Specifically, HertzBeat includes data collection, data storage, visualization, alerting, and a web interface in a single package. This is in stark contrast with other popular monitoring solutions, such as the Grafana-Prometheus stack. The latter approach is more modular as it uses a different system for metrics visualization and data collection.
Apache HertzBeat adopts an agentless architecture. Unlike many other monitoring systems, Apache HertzBeat connects directly to the target system, pulling its telemetry data without the need for intermediary agents on each node. This design reduces the operational overhead of managing a fleet of agents on each node, scattered throughout the infrastructure.
Besides that, Apache HertzBeat defines specific monitors for different target systems, pulling telemetry data using the target system query. This design choice removes the need for running separate exporters for the different end systems.
3. Getting Started
Apache HertzBeat offers several methods for installing and operating the platform, such as the Helm package manager and running it as a standalone Docker container.
3.1. Installation
For brevity, let’s set up an instance using the standalone Docker container approach.
We create and start the Docker container using the docker run command:
$ docker run -d -p 1157:1157 -p 1158:1158 \
    --restart=always \
    --name hertzbeat apache/hertzbeat
The command above starts a Docker container running the apache/hertzbeat image. Then, it exposes the ports 1157 and 1158 to the local network. For a complete list of configuration options, we can consult the official installation documentation.
3.2. Basic Navigation
Once the container is in a healthy state, we open up its web interface through http://localhost:1157. Then, we log in to the web UI using the default username admin and password hertzbeat:
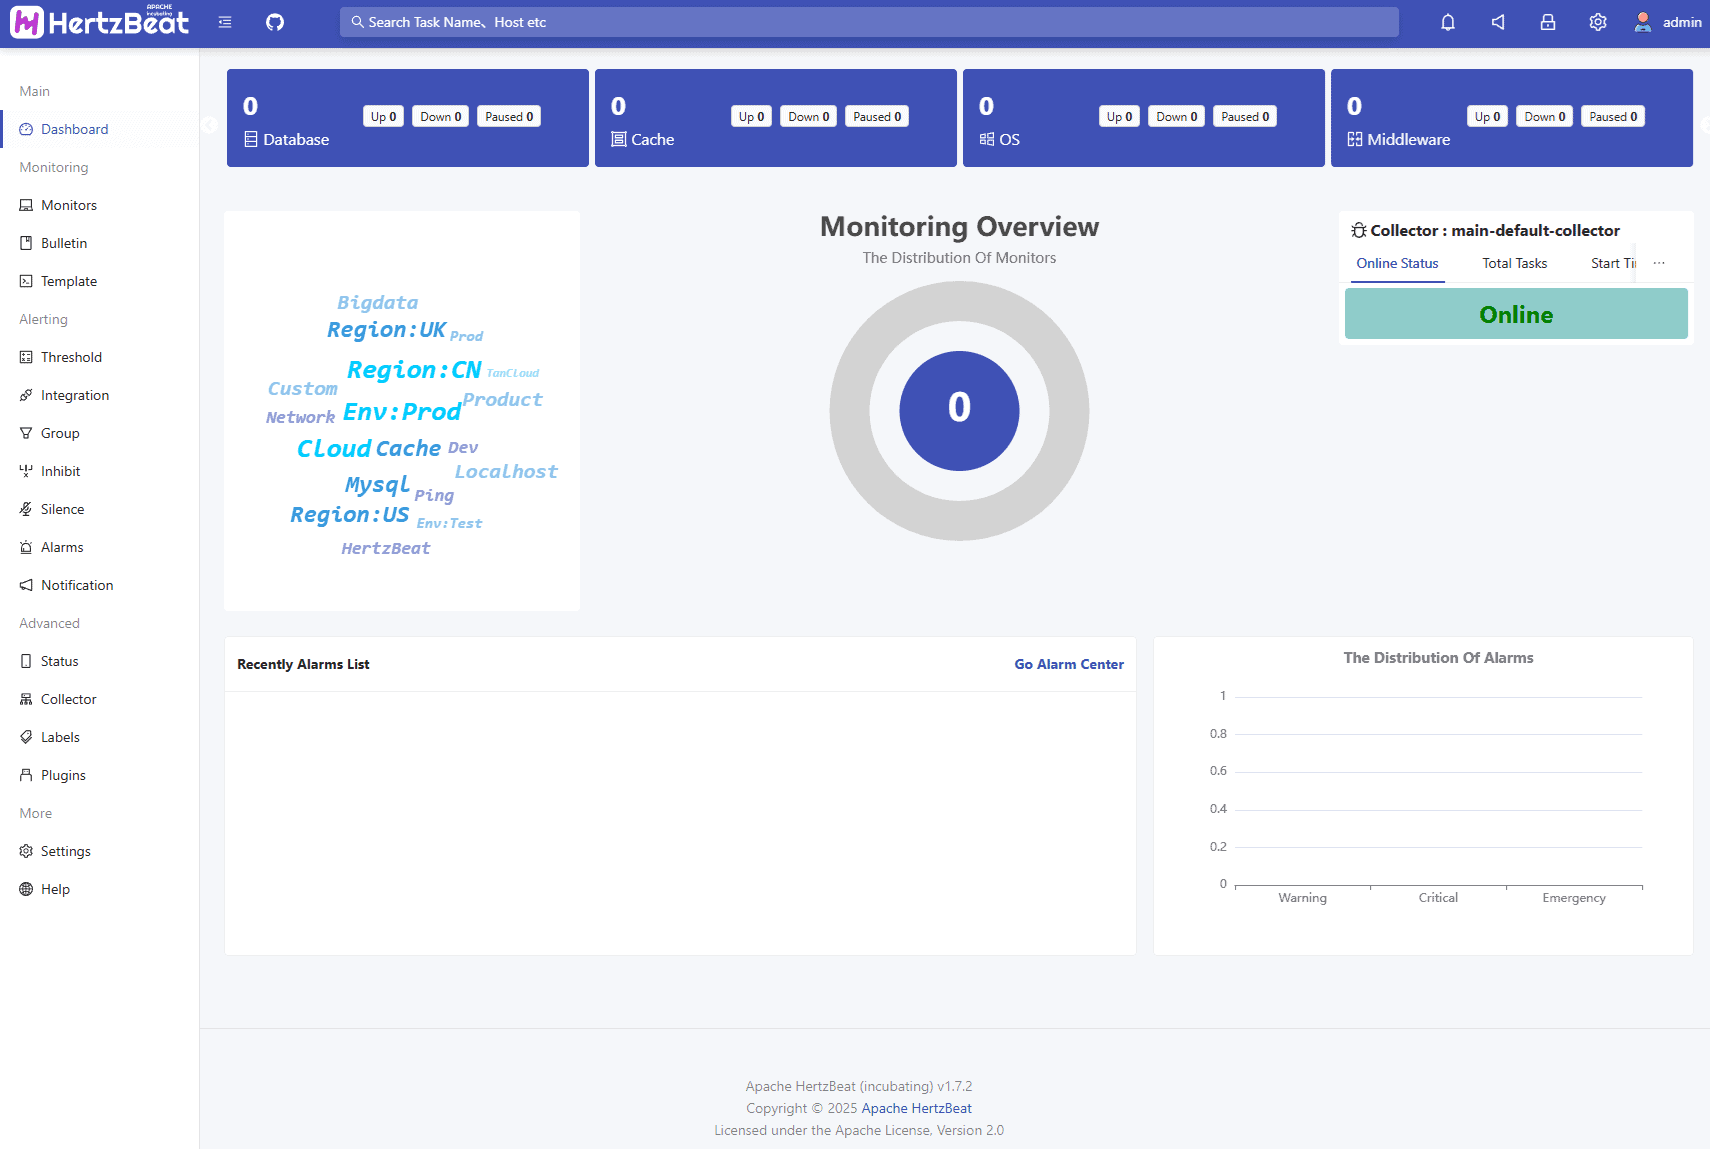
The home page shows a high-level overview of the monitors and alarms we have. On the left, the navigation bar shows all the components of the Apache HertzBeat instance.
In the subsequent sections, let’s go through the theory of some basic Apache HertzBeat components.
3.3. Monitor
Monitor is the fundamental construct in Apache HertzBeat that defines the policy of telemetry data pulling and the target system. This monitor construct is very specific to the target systems. Thus, we can pull metrics specific to the system without running a separate exporter process.
For instance, the PostgreSQL monitor connects to the target PostgreSQL instance and runs queries to extract metrics such as cache hit ratio and transaction details. On the other hand, JMX monitors can connect directly to a JVM-based process to collect metrics for class loading, thread counts, and heap memory.
3.4. Threshold and Alarm
In Apache HertzBeat, the threshold object is a predefined condition that determines whether the collected metric data violates a given rule. Subsequently, the threshold violation can trigger alarms to notify end users. In essence, a threshold is a policy that evaluates the underlying metric data and decides if alarms should be triggered.
There are two types of thresholds:
- real-time threshold
- scheduled threshold
Real-time thresholds are evaluated whenever the underlying metric data is updated and therefore provide a more instantaneous evaluation. On the other hand, the scheduled threshold is evaluated periodically. These thresholds are useful for expensive data aggregation because they might not require an aggressive evaluation, effectively reducing computation cost.
4. Setting up a PostgreSQL Monitoring and Alarm Rules
In the subsequent sections, we demonstrate the basic usage of Apache HertzBeat. Specifically, we want to create a monitor for a PostgreSQL instance on the same host and define a threshold for the availability of the PostgreSQL instance. In the end, we bring down the PostgreSQL instance to verify that the threshold is indeed triggering the alarm.
4.1. Creating a PostgreSQL Monitor
To begin with, let’s follow the steps to create a monitor:
- Go to the Monitoring Center page
- Press the New Monitor button on the top left of the page
- Find and select PostgreSQL DB under the DB Monitor options in the search box
Subsequently, we fill up the database connection information and the metrics pulling policy:
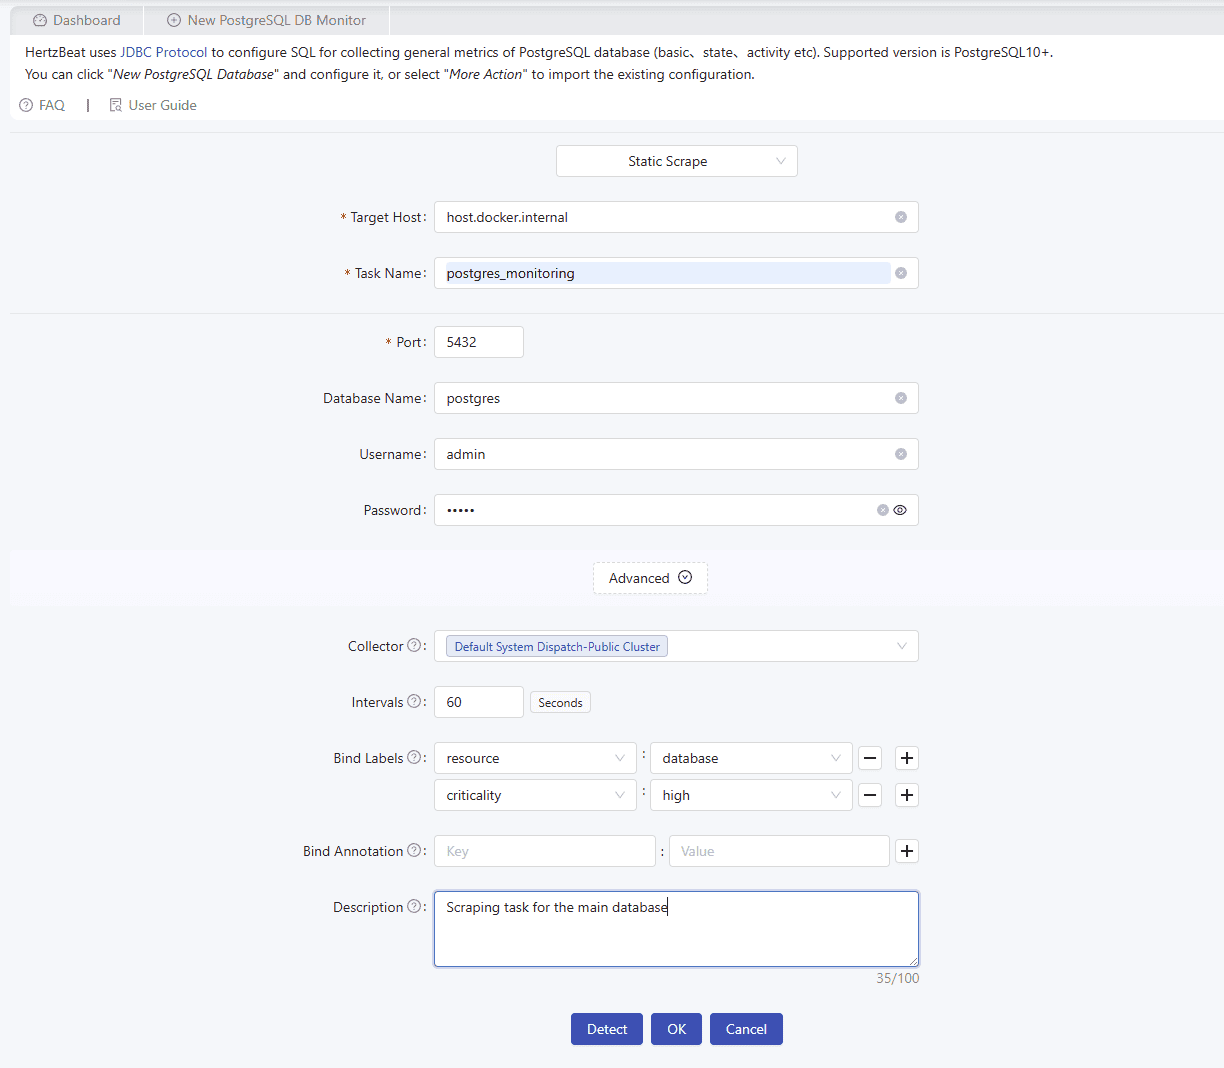
After filling in the information, we check for the connectivity by pressing the Detect button. If the connection is working, we press the OK button to save the configuration.
4.2. Checking the Monitor
Back to the Monitoring Center page, we see that a new postgres_monitoring task shows up in the list of active monitors.
Let’s navigate to the Monitor Detail page by clicking on the monitor name in the list:
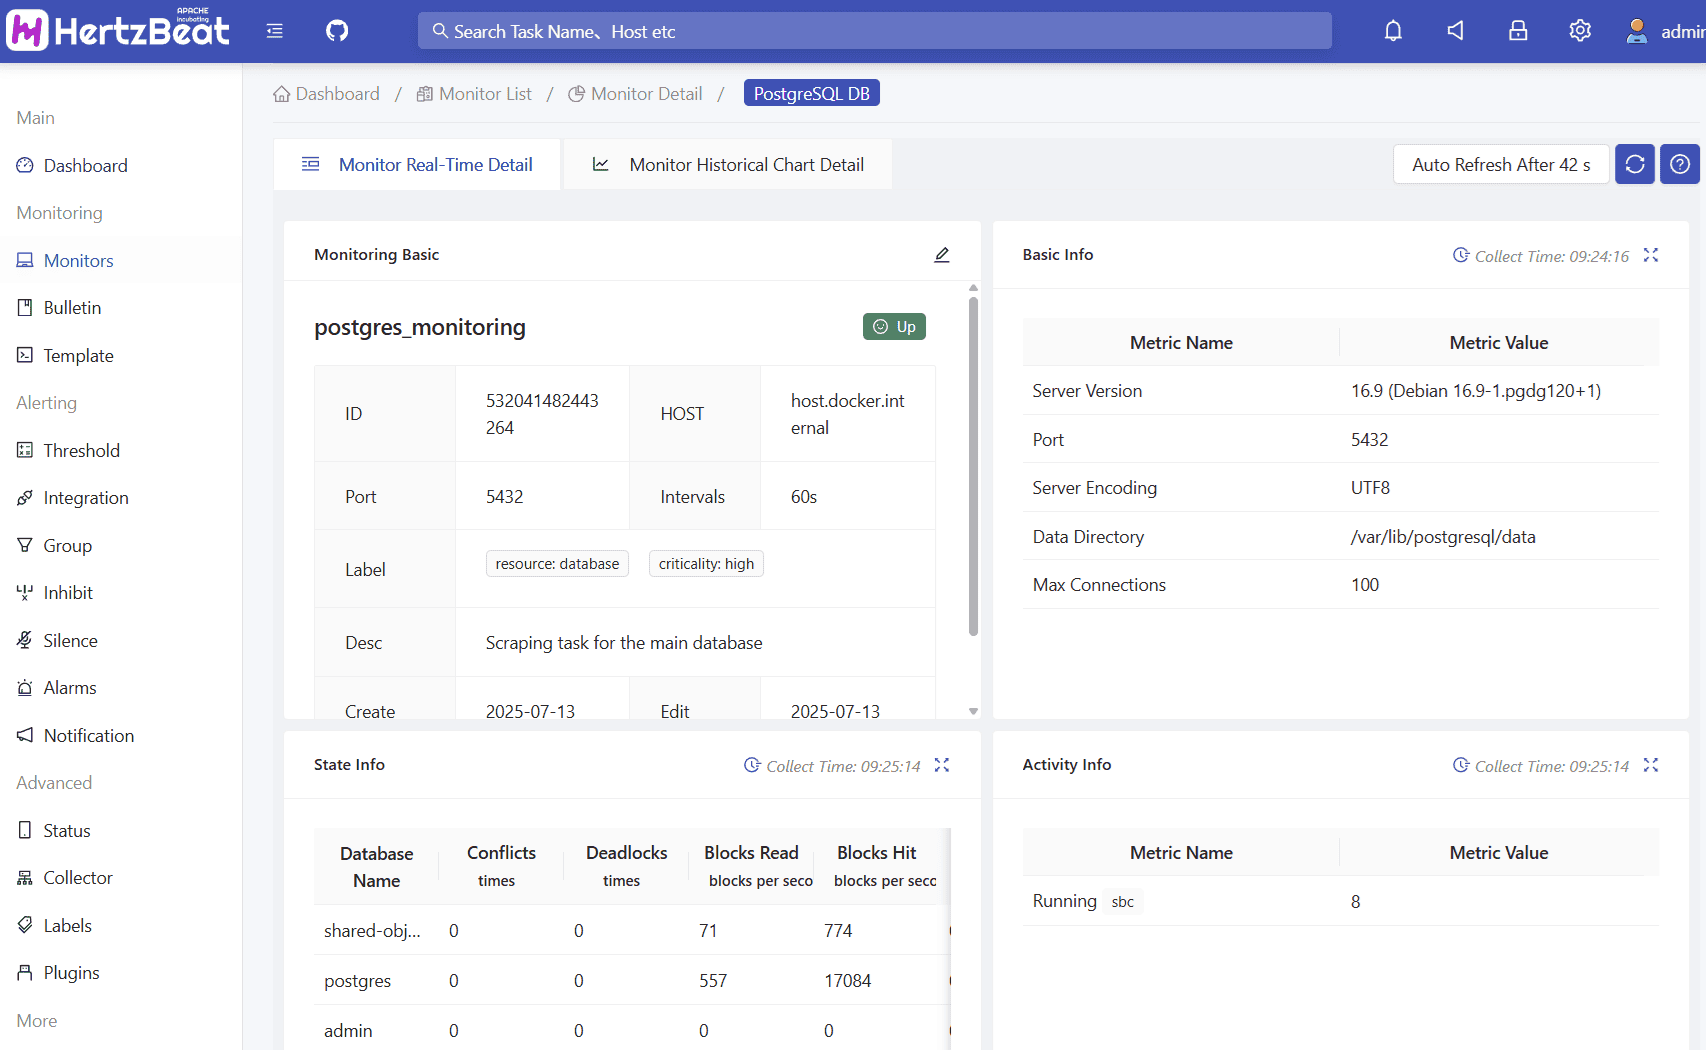
The monitoring detail page offers two views:
- real-time detail view
- historical chart
We can use the top tab button to switch between the views. The former shows the latest value the task has pulled from the target system. On the other hand, the historical view provides a chart to show the past metrics data.
The metrics are organized into various groups depending on the monitors. For instance, the PostgreSQL monitor has a pane showing all the metrics relevant to cache hits and another box showing the buffer information.
4.3. Creating a PostgreSQL Threshold
With an active monitor, we create a threshold to fire alarms when the metrics collected are abnormal. For this demonstration, we create a threshold that fires an alarm if the PostgreSQL instance is unavailable or unreachable.
First, we navigate to the Threshold page through the left navigation bar. Then, we press the New button and select real-time monitor.
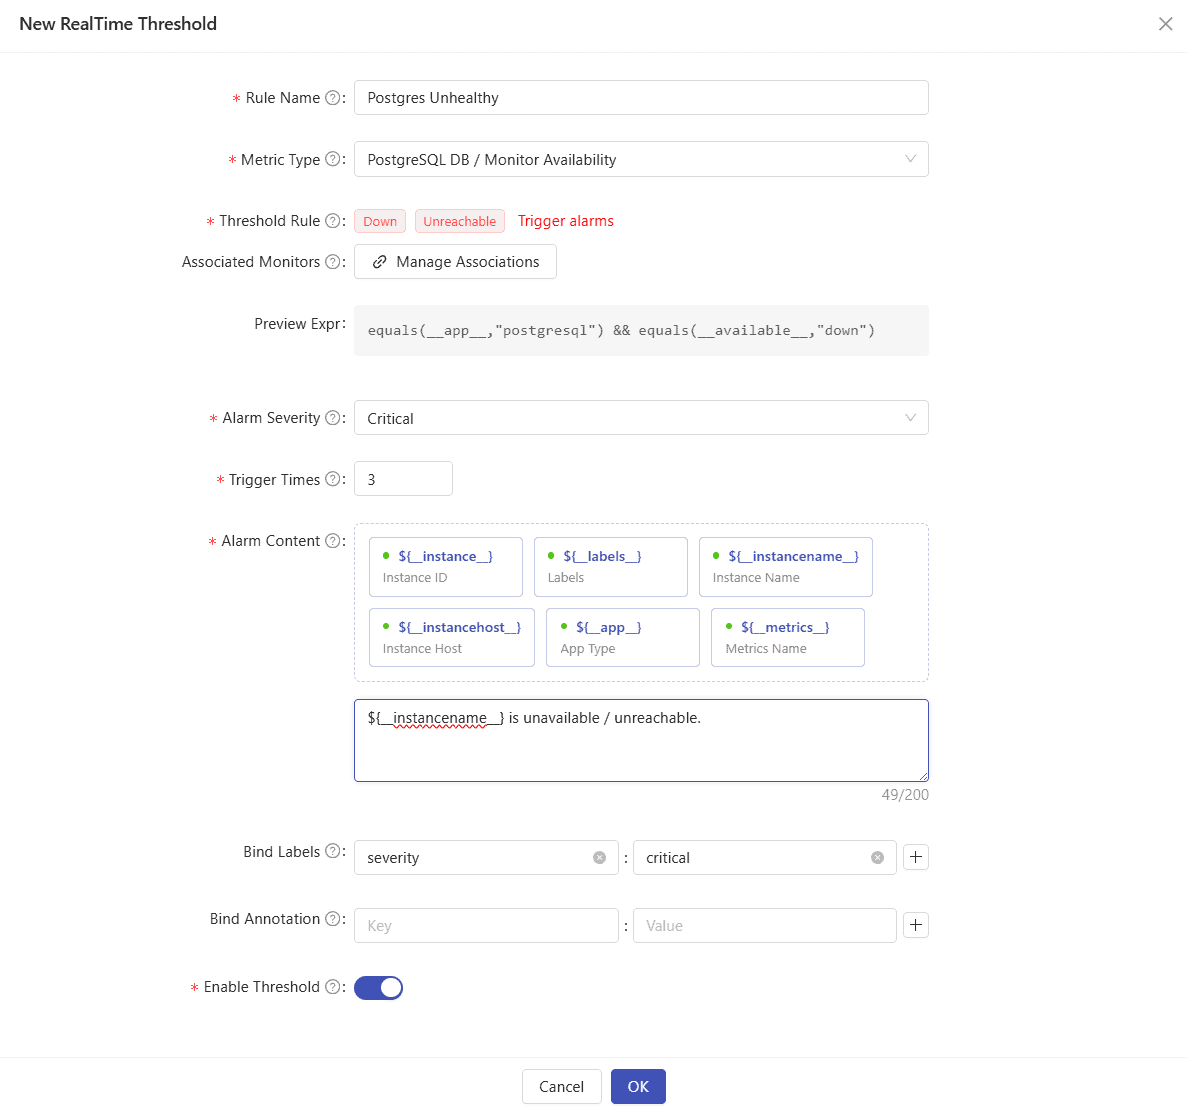
We set the metric type to PostgreSQL DB / Monitor Availability. This metric type has a threshold rule: to trigger an alarm when the availability is Down or Unreachable. Many other metrics offer more powerful rules that require more planning when configuring.
Additionally, we can configure the severity of the alarm and the number of threshold breaches before an alarm is triggered. For this threshold, we trigger an alarm when the last three availability data points collected are abnormal.
4.4. Triggering Alarm
To trigger the alarm, we bring down the PostgreSQL instance. This results in the availability metric collected by the monitor showing unavailable, thereby violating the threshold.
After the required time has elapsed, the alarm is correctly shown in the Alarm Center due to the threshold violation:
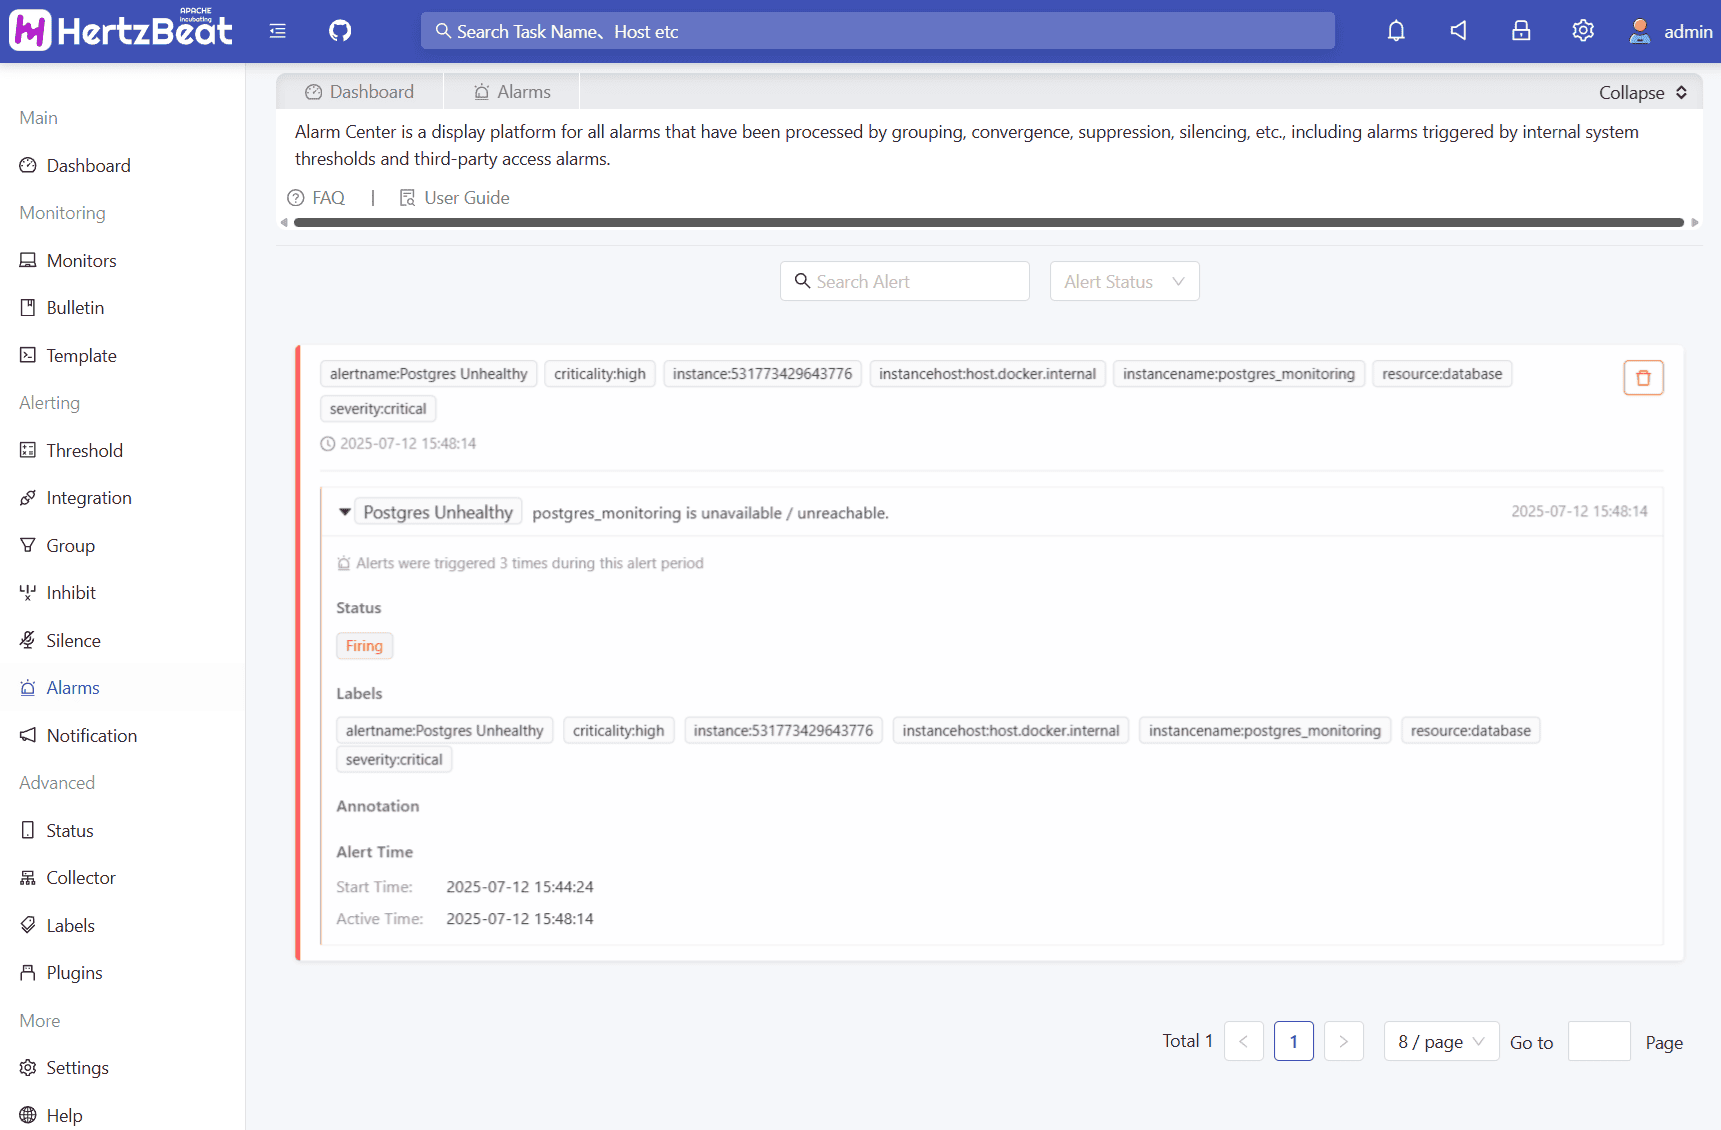
This way, we ensure the setup works as intended.
5. Conclusion
In this tutorial, we’ve learned that Apache HertzBeat is an open-source real-time monitoring platform. Additionally, we’ve briefly explained how Apache HertzBeat is an all-in-one solution, different from alternatives like modular monitoring solutions.
Then, we’ve walked through the basic components of Apache HertzBeat, including monitor, threshold, and alarm. Subsequently, we’ve demonstrated the usage of Apache HertzBeat by creating a monitor on a PostgreSQL instance. Later, we defined a threshold on that monitor to trigger an alarm if the instance becomes unavailable. Finally, we observed the firing of the alarm when we brought down the PostgreSQL instance, validating that the threshold is working as expected.