

Learn through the super-clean Baeldung Pro experience:
>> Membership and Baeldung Pro.
No ads, dark-mode and 6 months free of IntelliJ Idea Ultimate to start with.
Last updated: February 28, 2025
Learn through the super-clean Baeldung Pro experience:
>> Membership and Baeldung Pro.
No ads, dark-mode and 6 months free of IntelliJ Idea Ultimate to start with.
Machine learning consists of applying mathematical and statistical approaches to get machines to learn from data. It consists of four big families of techniques:
In this article, we’ll explore the purpose of machine learning and when we should use specific techniques. Consequently, we’ll find out how they work based on simple examples.
Supervised learning is a technique consisting of providing labeled data to a machine learning model. The labeled dataset is usually data gathered from experience, also called empirical data. In addition, the data often requires preparation to increase its quality, fill its gaps or simply optimize it for training.
Let’s take the following dataset of types of wines as an example:
| Type | Acidity | Dioxide | pH |
|---|---|---|---|
| white | .27 | 45 | 3 |
| red | .3 | 14 | 3.26 |
| white | .28 | 47 | 2.98 |
| white | .18 | 3.22 | |
| red | 16 | 3.17 |
Now let’s see what it looks like after preparation:
| Type | Acidity | Dioxide | pH |
|---|---|---|---|
| 1 | .75 | .94 | .07 |
| 0 | 1 | 0 | 1 |
| 1 | .83 | 1 | 0 |
| 1 | 0 | .52 | .86 |
| 0 | .67 | .06 | .68 |
We’ve corrected problems related to the quality of the dataset (missing cells) and optimized it to ease the learning process. For example, we can see that the values red and white have been replaced by digital values.
Depending on the use case, we’ll use either classification or regression models.
Let’s discover what those terms mean and how to choose which fits best.
Firstly, let’s assume that we have a dataset of car images. We want to classify those images by type: sedan, truck, van, etc. As a result, for this kind of use case, we want to use a classification model.
This type of model will classify our inputs in one of the predefined and exhaustive classes, in this example by type of car.
But before doing that, we’ll feed it a large set of images of cars labeled with the correct output class. This is what we call the training step.
After that, the model will be tested on another set of labeled images that it has never processed before. This step is crucial to know how the model behaves given new data to work with.
Finally, we can consider the model mature if the results are reaching a certain level of correct prediction. The level usually depends on the cruciality of the use case. For example, a model filtering out spam is less crucial than a model operating an automated vehicle. We calculate the accuracy of a model using a loss function.
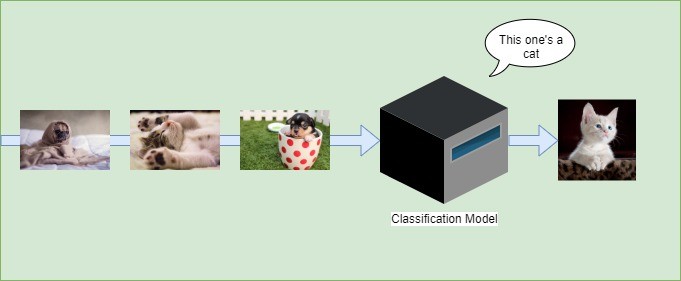
As an illustration, the image hereunder is an example of a classification model consisting of two classes: cat and not a cat:
Let’s list some of the algorithms used for classification:
On the other hand, regression will not give a class as output but a specific value also called a forecast or prediction.
We use regression models to predict those values based on historical data. In that way, it’s not much different than the classification model. It also requires a training step and a test step.
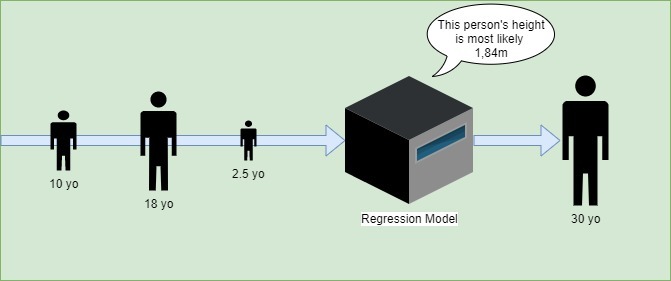
For instance, let’s say we have the ages of people and their respective height. Using this data, we’ll be able to build a model predicting what someone’s height is most likely to be, based on their age:
Let’s see what algorithms can be used for regression:
We notice that most of them were also listed in the classification subsection.
In contrast with supervised learning, unsupervised learning consists of working with unlabeled data. In fact, the labels in these use cases are often difficult to obtain. For instance, there is not enough knowledge of the data or the labeling is too expensive.
Moreover, the lack of labels makes it difficult to set goals for the trained model. It’s therefore complicated to measure whether results are accurate. Even though that is the case, multiple techniques allow obtaining results that lead to obtaining a better grip on the data.
Clustering consists of discovering clusters of similar items based on some of their features. In other words, this technique helps in revealing patterns in data.
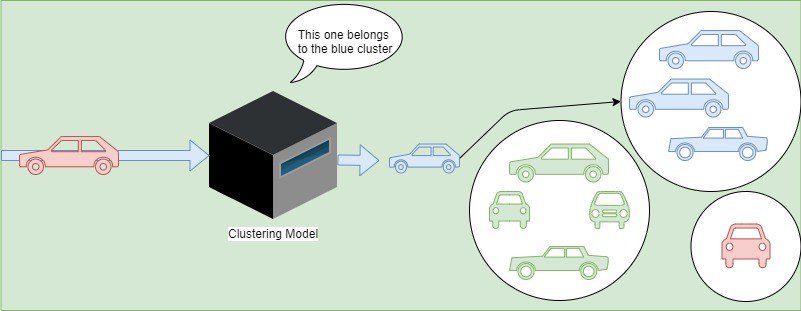
For example, we’ll say we have inputs consisting of cars. Besides, the dataset is not labeled, we have no idea what their similar features or set of features could lead to as clusters. The clustering model will find patterns. As an illustration, in the case presented below, it finds a way of grouping cars using their respective colors:
Let’s discover some clustering algorithms:
Dimensionality refers to the number of dimensions in a dataset. For example, dimensions can represent features or variables. They describe entities in the dataset.
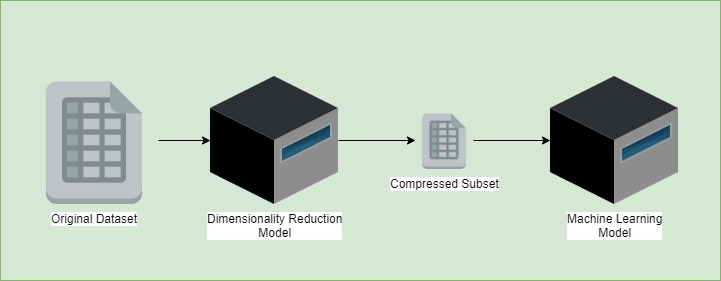
The goal of this technique is to detect correlations between different dimensions. In other words, it will help us find redundancy in the dataset features and reduce it. As an example, we can think of two features giving the same information in different forms. As a consequence, the algorithm will only keep one of these columns in the compressed subset.
After that, we’ll keep only the minimal necessary dimensions needed without losing any crucial information. In the end, this technique helps to get a better dataset, optimizing the further training step:
We can note a non-exhaustive list of dimensionality reduction algorithms:
Similarly to supervised and unsupervised learning, semi-supervised learning consists of working with a dataset.
However, datasets in semi-supervised learning are split into two parts: a labeled part and an unlabeled one. This technique is often used when labeling the data or gathering labeled data is too difficult or too expensive. The part of the data labeled can also be of bad quality.
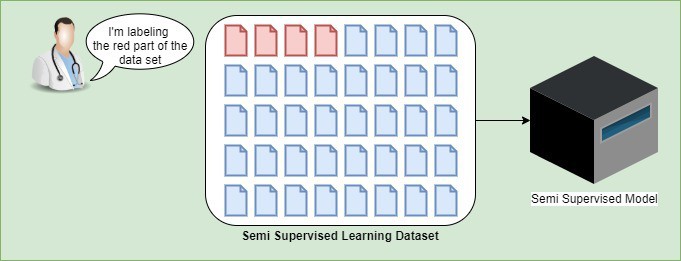
For example, if we take medical imaging to detect cancer, having doctors labeling the dataset is a very expensive task. Moreover, those doctors have other more urgent work to do. For instance, hereunder, we can see that the doctor has labeled part of the dataset and left the other one unlabeled.
Finally, this technique of machine learning has proven to perform good accuracy even if the dataset is partially labeled.
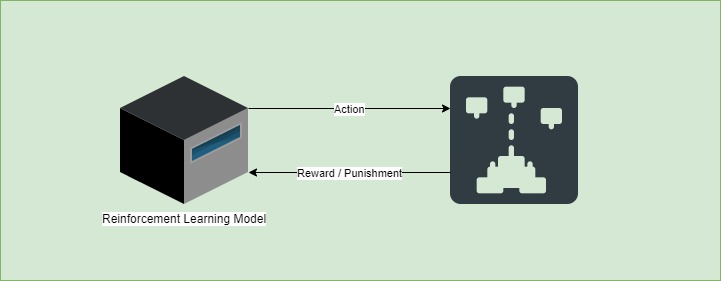
In reinforcement learning, the system learns exclusively from a series of reinforcements. Those can be positive or negative in relation to a system goal. Positive ones are known as “rewards” while on the other hand, we’ll call the negative ones “punishments”.
For instance, let’s take a model playing a video game. The system gets a reward when it wins more points. But then, if it loses, the model will receive a punishment. As a result, the model can then identify what moves were good in terms of strategy.
The moves’ values will then be added to each other to build a short-term strategy as well as a long-term one. As a consequence, the model will learn how to play the game and accumulate the most awards possible.
Finally, the model evolves with each action and reward or per batch of actions and rewards.
Some algorithms for reinforcement learning are:
The ideal generic algorithm does not exist. Each algorithm has its strengths and weaknesses. Depending on the use case and different factors, we’ll choose one or the other algorithm.
Let’s take a look at some non-exhaustive points to consider when choosing an algorithm:
In conclusion, we’ve discovered multiple techniques to apply machine learning. We now know these techniques come in different flavors but all have a point in common: they always consist of maths and stats techniques.