Learn through the super-clean Baeldung Pro experience:
>> Membership and Baeldung Pro.
No ads, dark-mode and 6 months free of IntelliJ Idea Ultimate to start with.
Last updated: February 28, 2025

Learn through the super-clean Baeldung Pro experience:
>> Membership and Baeldung Pro.
No ads, dark-mode and 6 months free of IntelliJ Idea Ultimate to start with.
In this tutorial, we’re going to explore a visual technique to detect patterns in a time series.
A time series is nothing more than two columns of data, with one of the columns being time. An example could be the minimum temperature of a city in one year or seismographic activity in a month. Finding a pattern in the time series can help us understand the data on a deeper level.
Additionally, it can help us to find the cause of the pattern or a way to manipulate it:
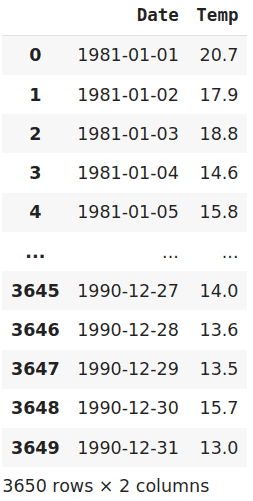
The above Time Series Data Example shows the temperature in Melbourne, Australia over the span of ten years.
Many methods that recognize patterns in time series do so by first transforming the time series to a more common type of data. Then a classical machine learning algorithm is used to detect and classify the pattern.
Visual pattern recognition achieves this by first transforming the data into a picture. Then we use image classification algorithms to detect the pattern. But how can we transform one-dimensional data into a picture?
Our first step is to calculate a discrete differentiation. We do so by subtracting each point in our time series from the previous one. Then we plot our data point, with its x- coordinate being its value, and its y-coordinate its discrete differentiation. In the next step, we compare the transformation to our pattern, and apply image classification methods to it, e.g. analyzing its features.
Let’s take a closer look at our previous time series, describing the temperature in a city over a given time span:
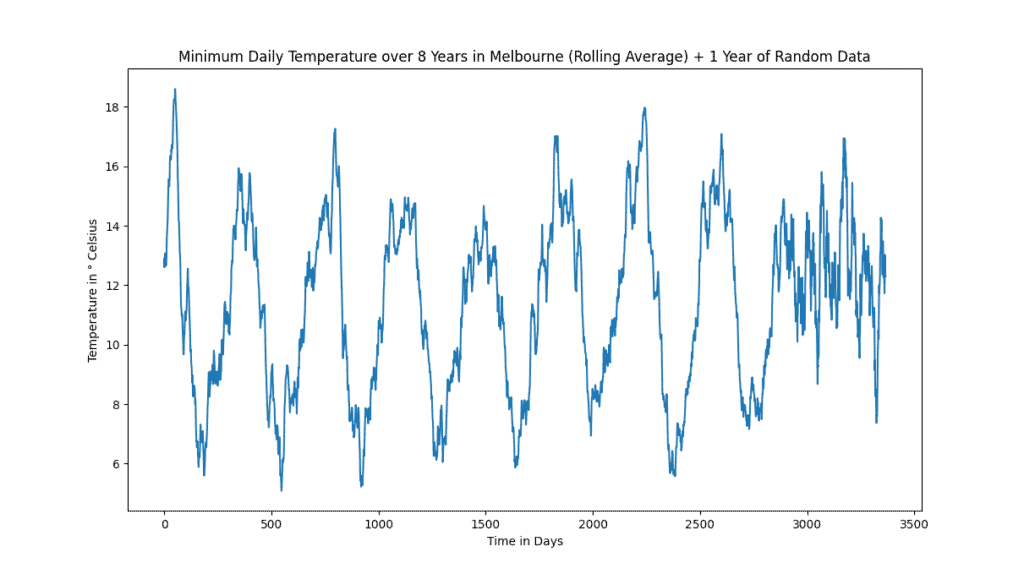
The original data can be found here. At the end of the time series, we add one year of random data. Our pattern recognition takes the first year as a pattern. With that pattern, we should be able to successfully detect the following 7 years, while also showing that our last year doesn’t belong.
After applying the visual pattern recognition, our time series is transformed into 9 different images, one image for each year:
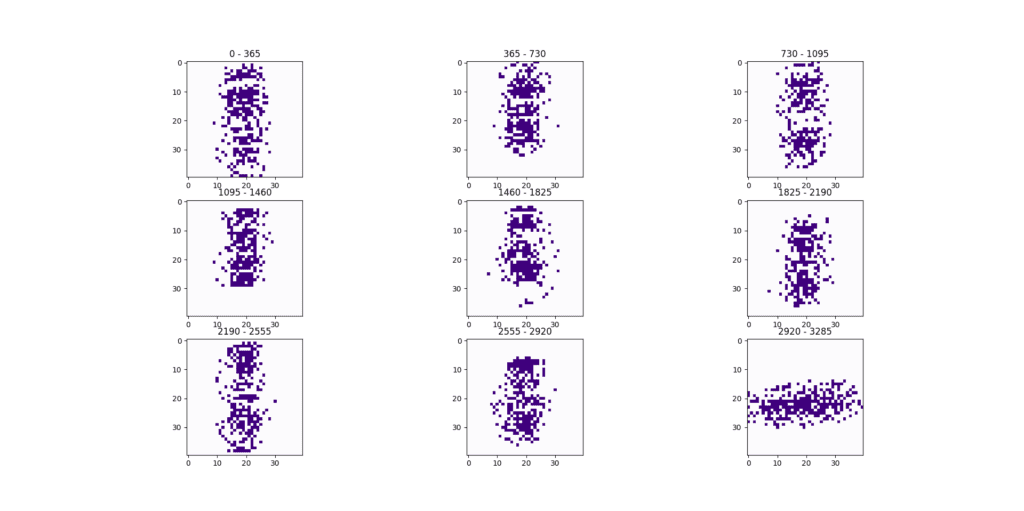
As we can see, every image looks very similar to the first one, with the last one being an exception. This is a difference that would be easily detected by an image recognition software. Even a simple histogram shows us the vectorial differences between the images:
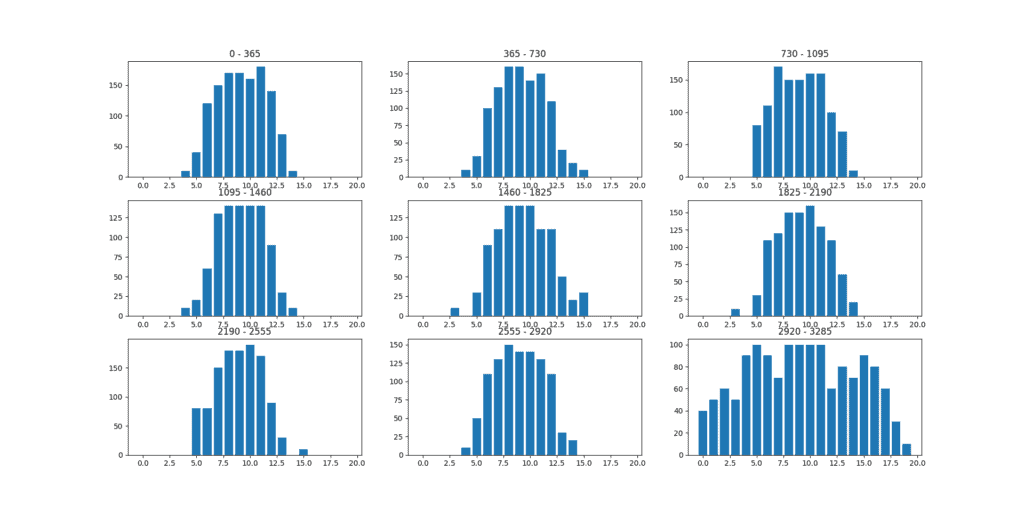
As the example shows, our method is very visual and we can easily see how our pattern is recognized. While this certainly becomes more complex with multiple patterns and different data, it still helps us to understand the steps that are going on in our analysis.
This makes our algorithm much easier to follow and modify in comparison to other time-series pattern recognition algorithms, such as a hidden Markov chain model.
In this article, we worked through a visual pattern recognition algorithm. We transformed features from a time series into a picture and continued our analysis with classical image recognition methods, such as the comparison of histograms.