

Learn through the super-clean Baeldung Pro experience:
>> Membership and Baeldung Pro.
No ads, dark-mode and 6 months free of IntelliJ Idea Ultimate to start with.
Last updated: March 18, 2024
Learn through the super-clean Baeldung Pro experience:
>> Membership and Baeldung Pro.
No ads, dark-mode and 6 months free of IntelliJ Idea Ultimate to start with.
Work Breakdown Structures (WBS) are practical tools for visualizing and breaking project hierarchies into manageable components.
With the power of LaTeX and tikz, we can create professional-looking WBS diagrams that seamlessly integrate with our LaTeX documents.
In this tutorial, we’ll create a WBS using LaTeX and tikz.
First, we need the tikz package.
The tikz package is a powerful tool for creating graphics and diagrams in LaTeX. It offers various libraries that extend its functionality. These libraries provide predefined shapes, arrows, patterns, and more. We can create common graphical elements and customize their appearance.
In this article, we’ll recreate a computational intelligence breakdown structure:
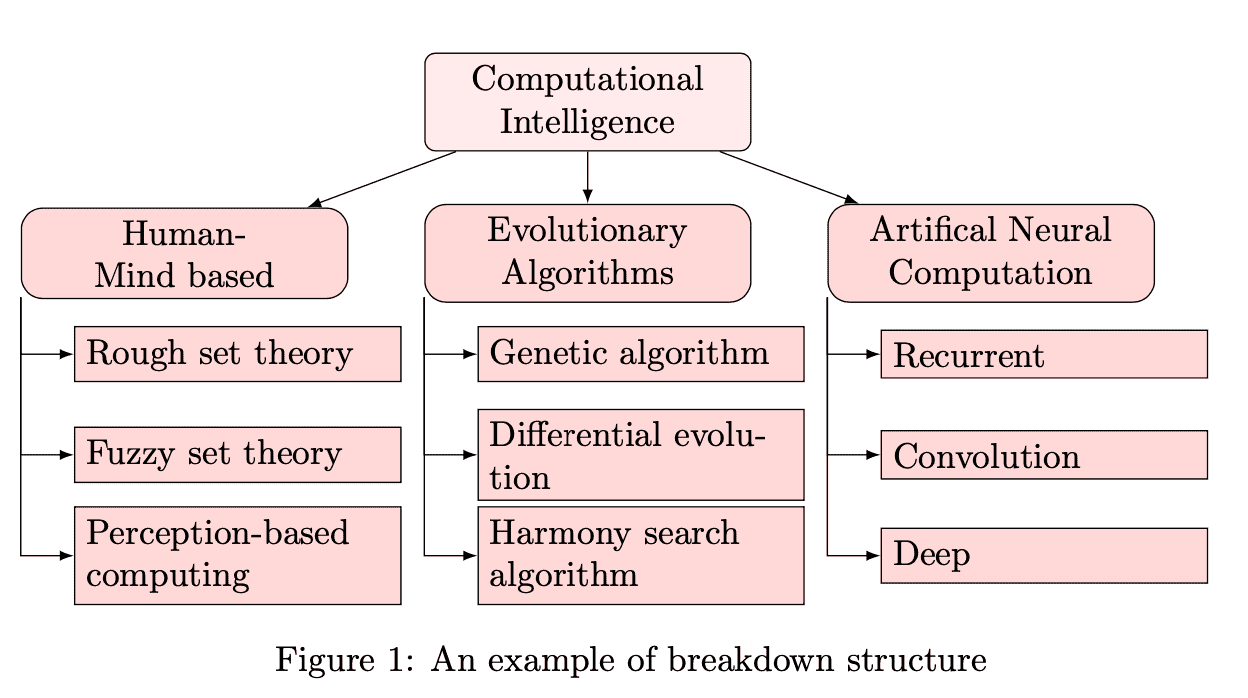 Let’s draw this figure using the tikz package.
All the commands should be in the tikzpicture environment:
begin{tikzpicture}
% the tikz code for drawing a WBS will come here
end{tikzpicture}We can define any custom styles that we need for our WBS. This step is optional but can help maintain consistency in the appearance of WBS. Here’s an example:
\tikzset{
	rectangle/.style  = {draw, text width=3cm},
	style1/.style = {rectangle, rounded corners=3pt, thin, align=center, fill=pink!30},
	style2/.style = {rectangle, rounded corners=6pt, thin, align=center, fill=pink!60},
	style3/.style = {rectangle, thin, align=left, fill=pink!60}
}
The arguments are as follows:
We use the \node command to position the nodes in the WBS:
level 1/.style={sibling distance=40mm},
edge from parent/.style={->,draw},>=latex]
% root of the the initial tree, level 1
\node[style1] {Computational Intelligence}
% The first level, as children of the initial tree
child {node[style2] (c1) {Human mind based}}
child {node[style2] (c2) { Evolutionary Algorithms}}
child {node[style2] (c3) { Artificial Neural Computation}};
This generates:
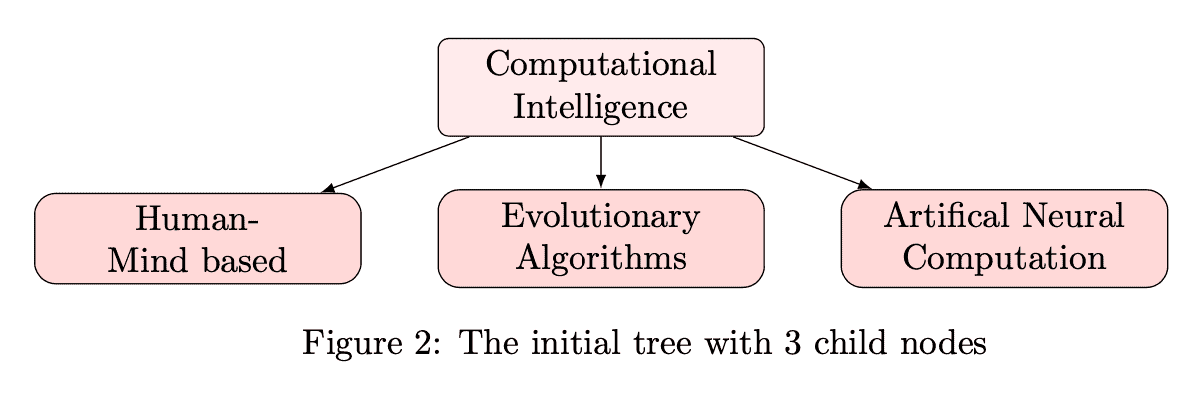
We set the distance of the child’s node from the root node as 40mm. The root node is defined with style1, and each child node is rendered according to style2. We label these child nodes c1, c2, and c3, respectively.
Now, we add children of the root’s children and apply our custom style3:
% Child 1 node
\node [style3, below of = c1, xshift=15pt] (c11) {Rough set theory};
\node [style3, below of = c11] (c12) {Fuzzy set theory};
\node [style3, below of = c12] (c13) {Perception-based computing};
% Child 2 node
\node [style3, below of = c2, xshift=15pt] (c21) {Gentic algorithm};
\node [style3, below of = c21] (c22) {Differential evolution};
\node [style3, below of = c22] (c23) {Harmony search algorithm};
% Child 3 node
\node [style3, below of = c3, xshift=15pt] (c31) {Recurrent};
\node [style3, below of = c31] (c32) {Convolution};
\node [style3, below of = c32] (c33) {Deep};
The result is:
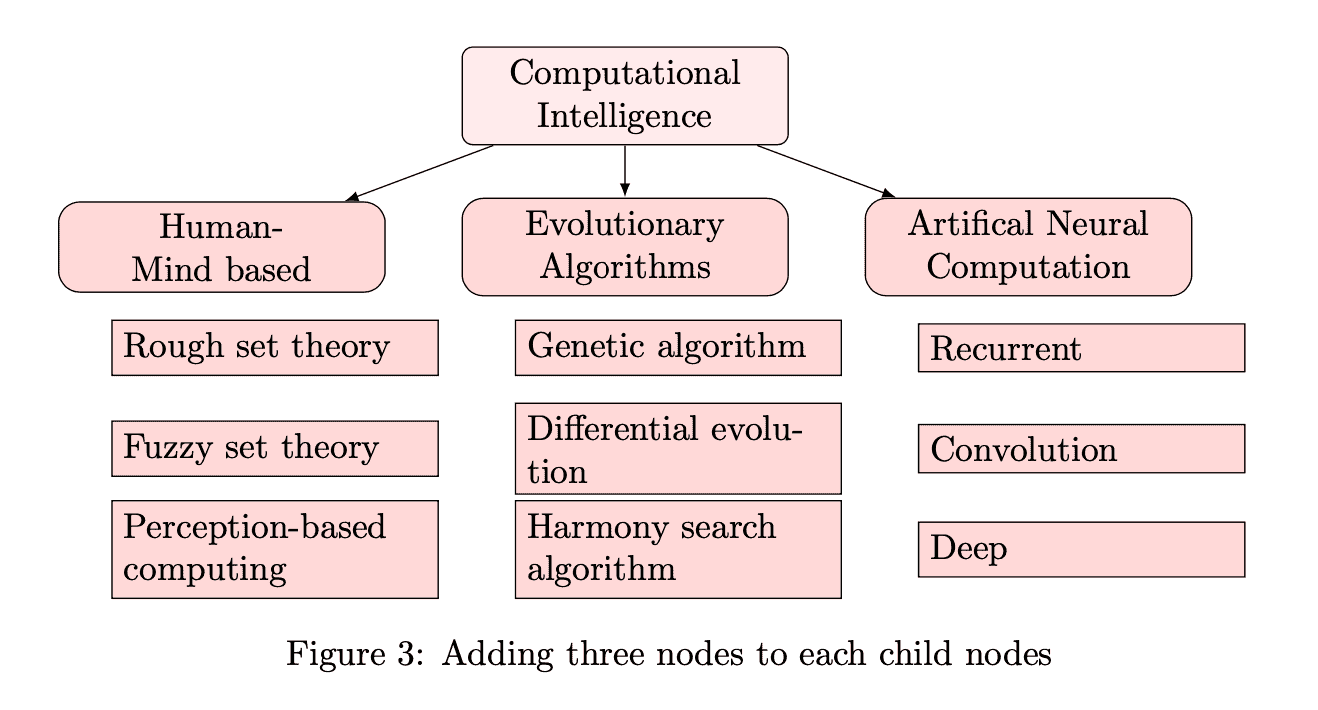
We specify the style and the position of each node (e.g., below of =c1), the horizontal distance from the child node (xshift=15pt), and the labels (c11, c21, c31). We add the text in curly brackets and as the last argument.
Lastly, we can add lines from each child node to the children nodes using the following code:
\foreach \value in {1,2,3}
        \draw[->] (c1.195) |- (c1\value.west);

\foreach \value in {1,2,3}
	\draw[->] (c2.195) |- (c2\value.west);

\foreach \value in {1,2,3}
	\draw[->] (c3.195) |- (c3\value.west);
With this, we get the WBS we wanted to draw:
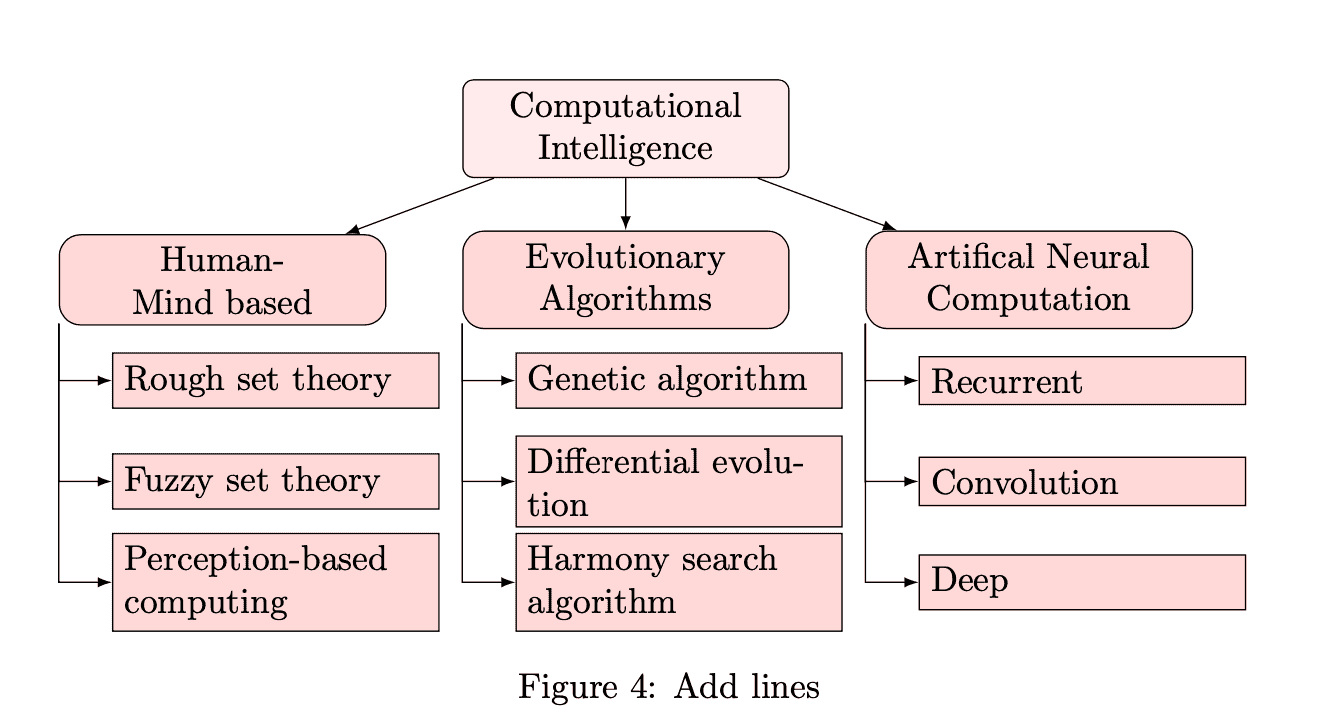
We can use a loop instead of manually entering the commands to draw lines.
In this article, we described how to draw a work breakdown structure (WBS) using tikz in LaTeX.
Drawing a WBS with LaTeX and tikz offers several benefits:
These advantages make LaTeX and tikz a powerful combination for creating visually appealing and highly customizable figures for LaTeX documents.