

Learn through the super-clean Baeldung Pro experience:
>> Membership and Baeldung Pro.
No ads, dark-mode and 6 months free of IntelliJ Idea Ultimate to start with.
Last updated: March 18, 2024
Learn through the super-clean Baeldung Pro experience:
>> Membership and Baeldung Pro.
No ads, dark-mode and 6 months free of IntelliJ Idea Ultimate to start with.
In this tutorial, we’ll study how to automatically layout the gridline intervals in a chart.
In our article on choosing a linear scale for the  -axis, we discussed how to identify the position of the ticks on an axis for a line chart. In this tutorial, instead, we analyze a related algorithm, that’s better suited to determine intervals in for the gridlines of a bar chart.
We first start with a chart that represents a distribution. For example, a chart containing the daily price of 10 independent stocks:
Then, we want to determine the correct number and placement of ticks on the -axis. Our objective is to identify the correct spacing between ticks, that will let us understand the relative placement of the observations with one another.
The range of the distribution is therefore the primary important constraint we have. Within it, we want to cover more or less uniformly the whole chart with gridlines. We also want, however, to avoid two common mistakes as we place the gridlines.
The first is the placement of too few lines in the range of the distribution, as this wouldn’t be conducive to understanding:
The second is the placement of an excessive number of lines. This would, in fact, lead to the risk of the overlapping between ticks, and would also crowd the image with unnecessary gridlines:
Instead, we want the gridlines to cover the chart well enough, but also to leave enough room among them to let us see both the ticks and the value of the variables. If we do things properly, we then obtain a chart that’s insightful but also sufficiently empty:
The thing to do now is to determine what numbers are nice ticks for the gridlines and which ones aren’t.
There’s a branch of pedagogy, mathematics, and graphics that are dedicated to studying the mechanisms for understanding mathematics through vision. Thanks to those disciplines, we can aprioristically identify the desirable interaction between numbers, semantics, and the human mind, which leads to maximal understanding by the reader.
We know, for example, that multiples of 1, 2, and 5, in any order of magnitude, are preferable to most readers. As an example, we can see that the numbers in the column to the left look better than the numbers in the column to the right:
| Nice | Not nice |
|---|---|
| 1 | 1.7 |
| 2 | 3 |
| 5 | 4.9 |
| 10 | 9 |
We also know that this consideration is valid regardless of the scale:
| Nice | Not nice |
|---|---|
| 0.1 | 0.17 |
| 20 | 30 |
| 0.05 | 0.49 |
| 1000 | 900 |
This means that there are scale-free methods for identifying nice numbers. This is important because if we identify a list of nice numbers in a predetermined interval, we can then scale it up or down as necessary. If, for example, we agree on a list of nice numbers in the interval ![[1,10]](/wp-content/ql-cache/quicklatex.com-b7c9bdbf0e1f203d0f6e502466b6a4e0_l3.svg "Rendered by QuickLaTeX.com") , the same list will be valid in the interval
, the same list will be valid in the interval  , provided we multiply it by
  .
.
We can therefore define an algorithm that identifies the span of the ticks for gridlines that correspond to nice intervals. The algorithm takes as an input the range of the distribution and the maximum number of ticks, as defined by the user or as parametrized by us. Upon its termination, it returns the list of ticks that corresponds to a nice interval between the gridlines:
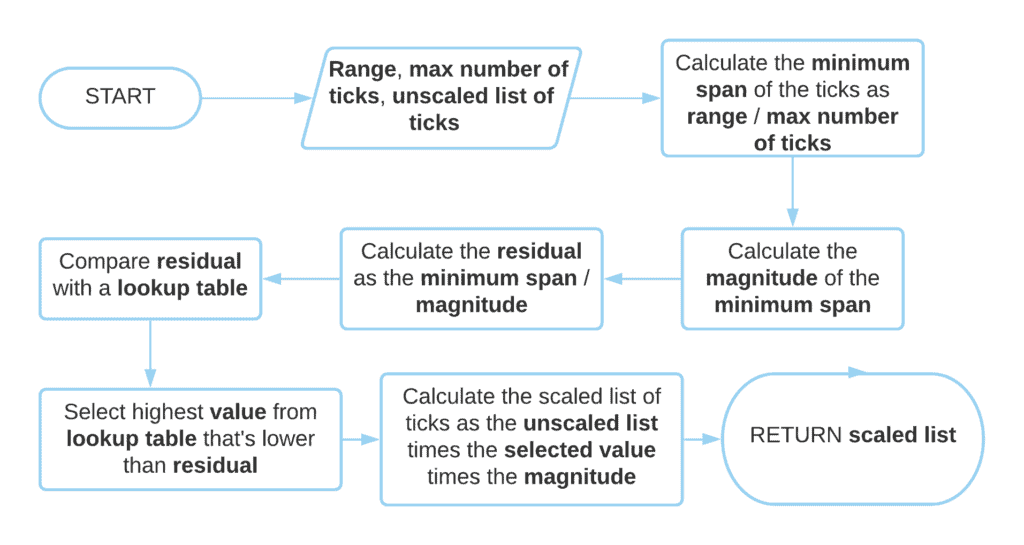
The algorithm requires the separate storage of a list of unscaled ticks, in this particular implementation. Alternatively, we can use the selected value from the lookup table times the magnitude as the interval between ticks. In this case, we place the ticks at each interval, starting from the lower bound of the distribution.
As a lookup table we can define our own, any, provided it’s in the interval and that both 1 and 10 are present. A common table is the one comprising the elements ![[1, 2, 2.5, 3, 5, 7, 7.5, 10]](/wp-content/ql-cache/quicklatex.com-7774a4d74abefed1a20b8385129b85f1_l3.svg "Rendered by QuickLaTeX.com") , but any other can be used instead.
, but any other can be used instead.
In this article, we studied an algorithm for placing nice gridlines on a bar chart.


