Debugging REST Requests in Spring Applications with Lightrun
We all faced that. You set up the server. Make the call to your REST service and… You get a weird failure. What happened here?
It worked great on my machine, why is it failing in the cloud?
Is it the CDN, is it my code, what’s going on?
I can’t tell you, but Lightrun usually can. Let me show you how…
For the purpose of this tutorial I’ll use the Pet Clinic demo. It’s a relatively simple demo which includes REST calls. You can use any code since I won’t rely on anything specific to that demo.
Step 1 – Build the Demo
Open the project directory from the repository in IntelliJ IDEA. Run the Package option in the Maven tool window.
Step 2 – Install Lightrun
If you didn’t do this yet, create a Lightrun account. Download the IDE plugin and set up the agent on your server. I won’t replicate the steps here as they are pretty clear on the website.
You can download the agent into the project directory then run the app using:
java -agentpath:PATH_TO_AGENT_DIRECTORY/lightrun_agent.so -jar target/spring-petclinic-2.4.5.jarNotice you need to replace PATH_TO_AGENT_DIRECTORY with the right path. Try to avoid shortcuts like ~ which might cause issues.
You can now install the plugin and log in via the IDE.
Step 3 – Place Snapshot to Debug Local Error
The first problem we want to debug is whether your code is reached. Often we don’t know if the first line of code was even hit. This is pretty easy to do.
Open the VetController class and go to line 43 which is the first line of the showVetList() method. Right click on the line and select Lightrun -> Snapshot:
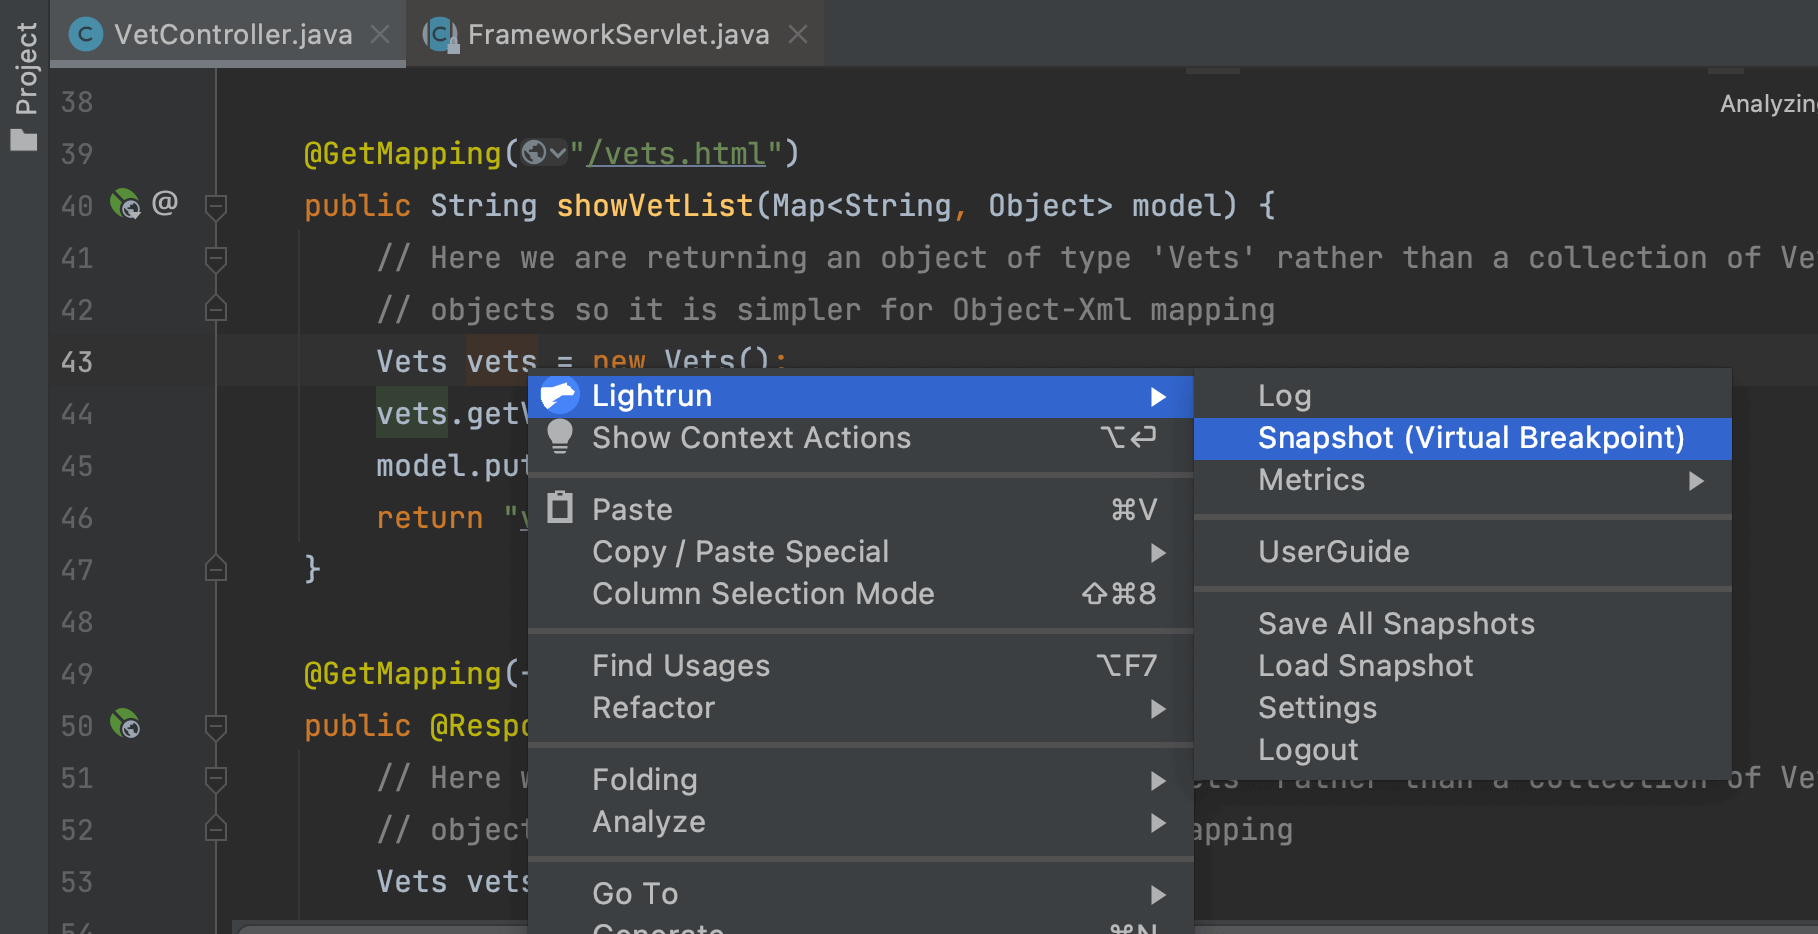
A snapshot is a breakpoint that doesn’t “break”. It gives you the stack trace, variables etc. It can be applied conditionally like any other breakpoint. But it won’t block the execution and won’t break the server.
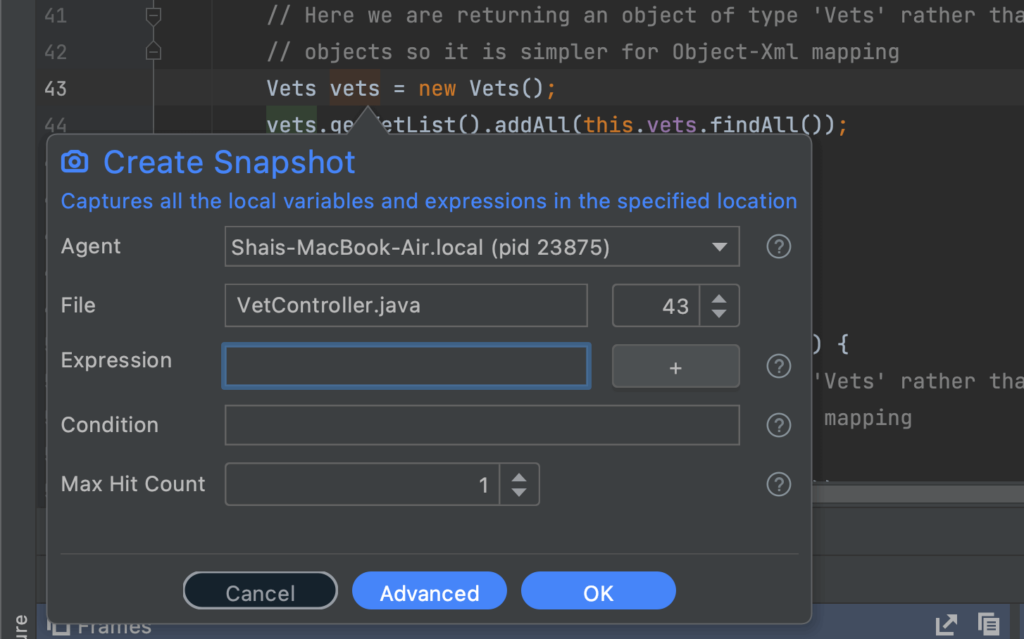
We will see a dialog like this that lets us tune snapshot parameters:
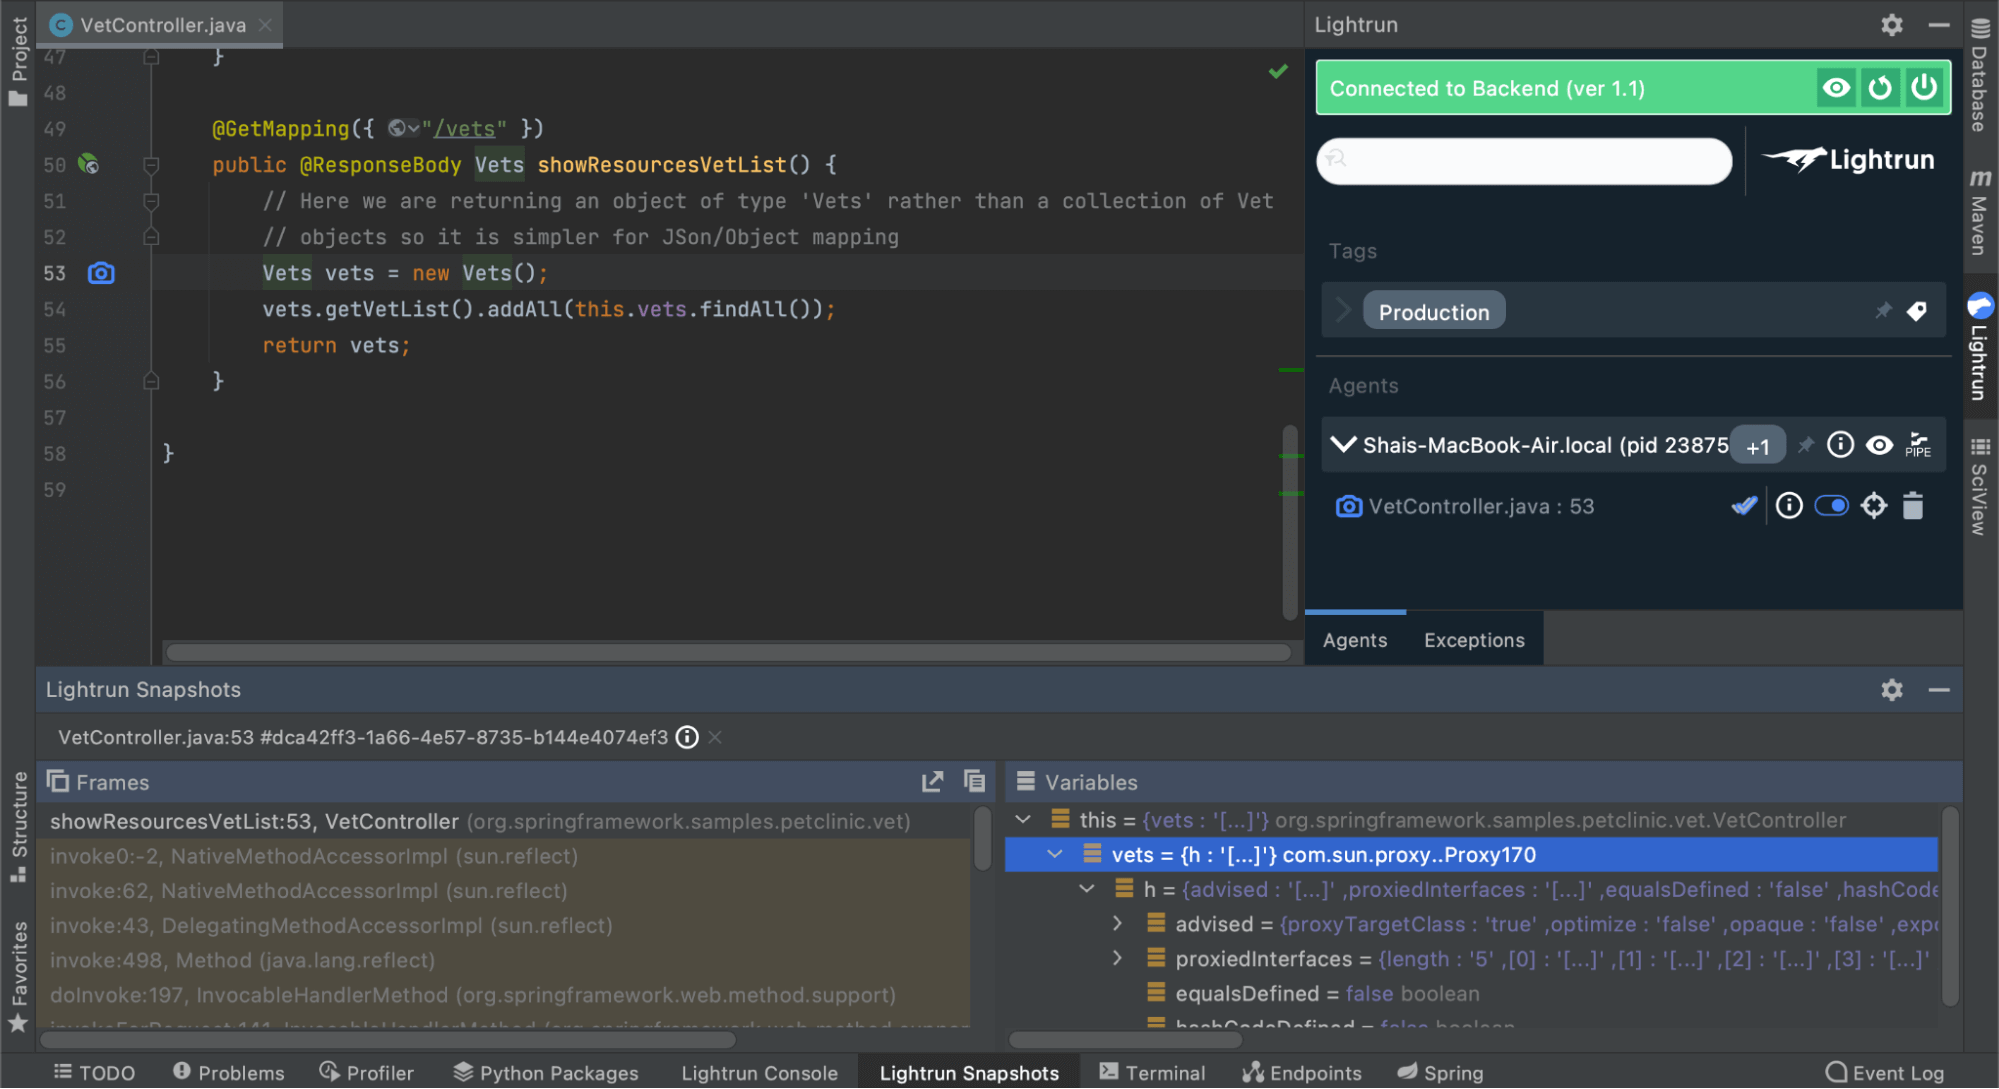
To see if the method was hit we invoke curl from the command line or visit the page in the browser:
curl http://localhost:8080/vetsIf the method was hit you would see the snapshot details in the IDE. You can inspect the variables and stack to see what went on:
If this wasn’t hit then your code wasn’t reached. In that case skip ahead to Step 5!
Step 4 – Add Logs to Understand
Assuming your code was hit but you still have errors, you can add snapshots or logs to pinpoint the area that failed. Notice you can add snapshots and logs dynamically without restarting your server. E.g. we can add a log to the bottom of the method like this:
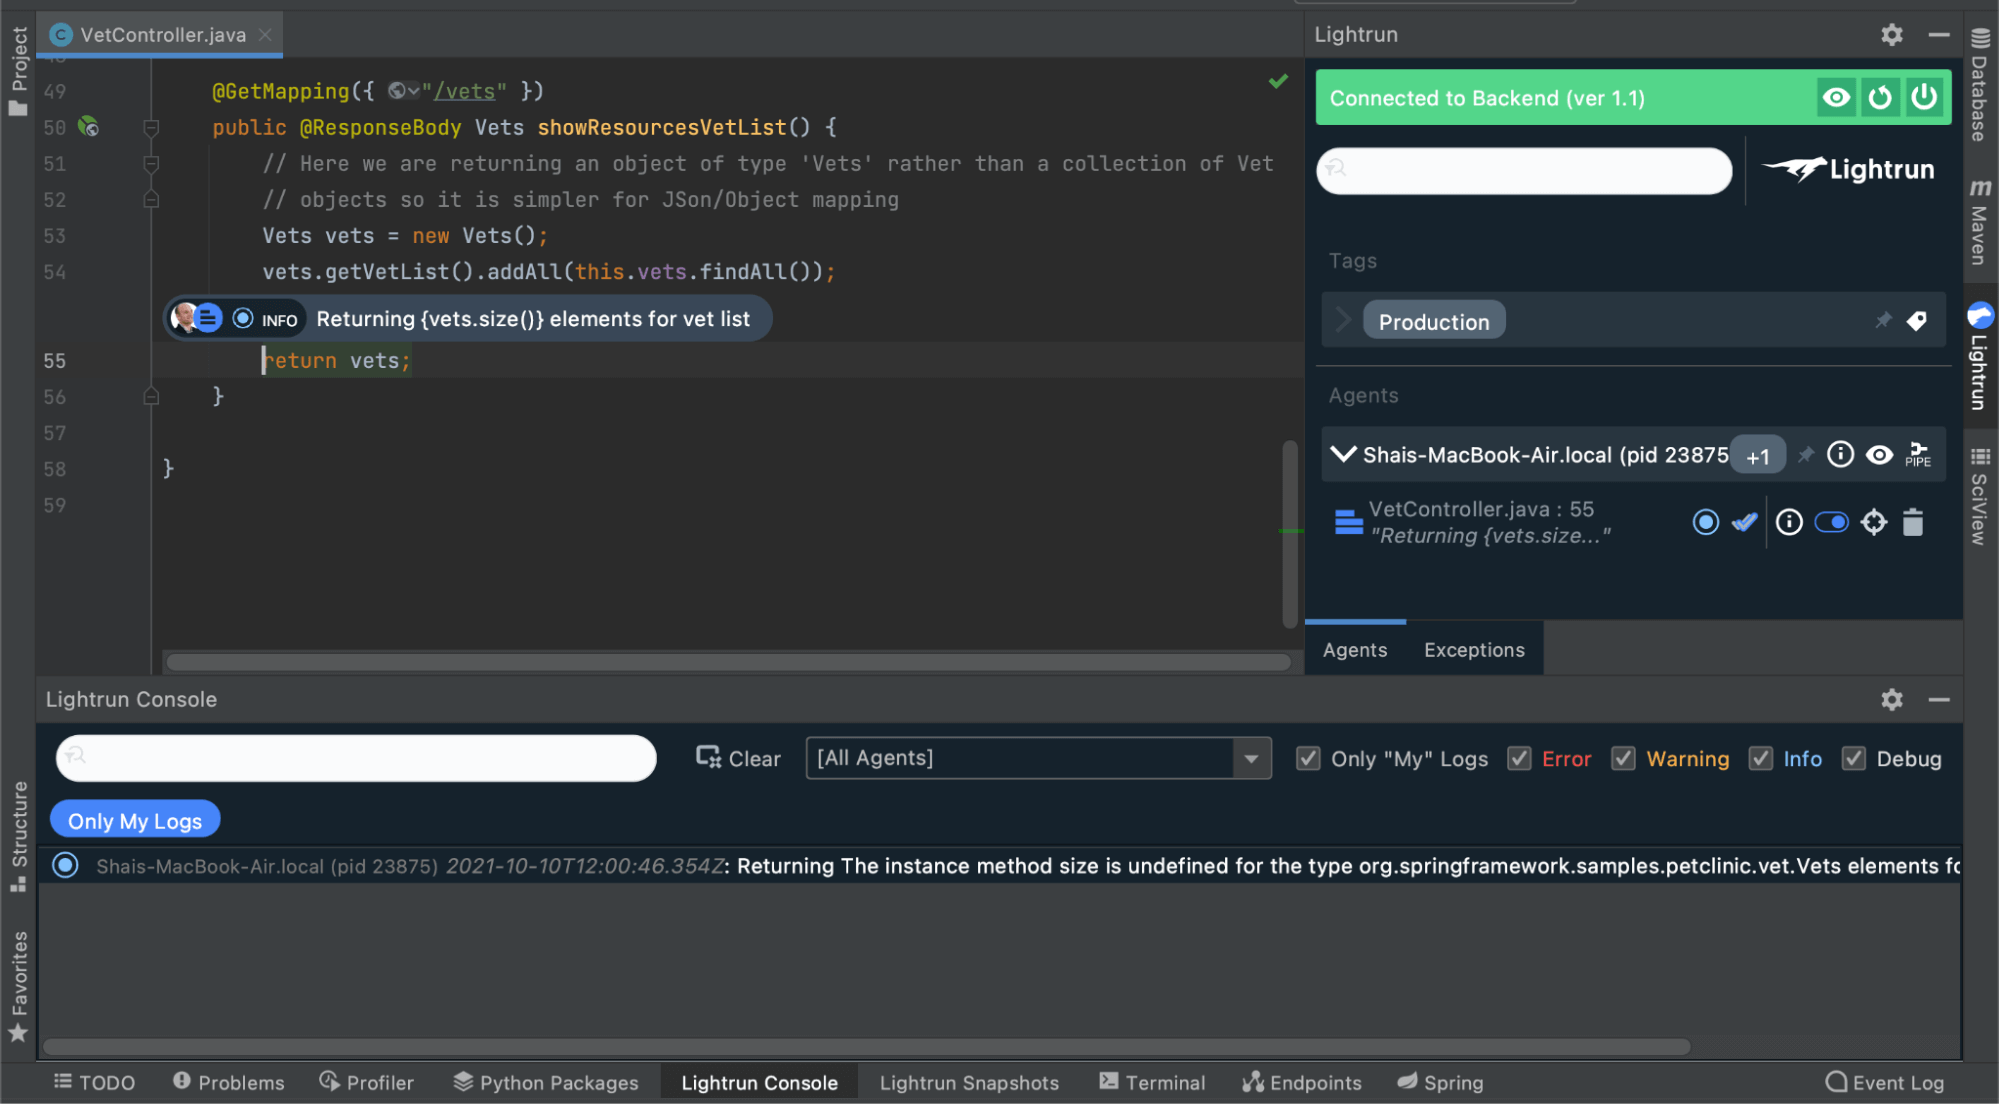
Notice that the log text is Returning {vets.size()} elements for vet list. The expression in the curly brackets is evaluated dynamically on the server and added to the log.
Step 5 – Debugging Spring
If your code wasn’t reached it means Spring didn’t pass it on or Spring didn’t even get the call. If it’s the latter, you need to check your CDN and general configuration. So you need to know if Spring was reached and why it rejected the call. (Two common reasons are wrong mime types and broken authorization.)
To do that, we need to debug into Spring itself. Because we need to do “deep” debugging into the Spring source code, we need an extra step of downloading the source code with Maven. In IntelliJ IDEA preferences, select Build, Execution, Deployment -> Build Tools -> Maven -> Importing and check the Automatically download sources option:
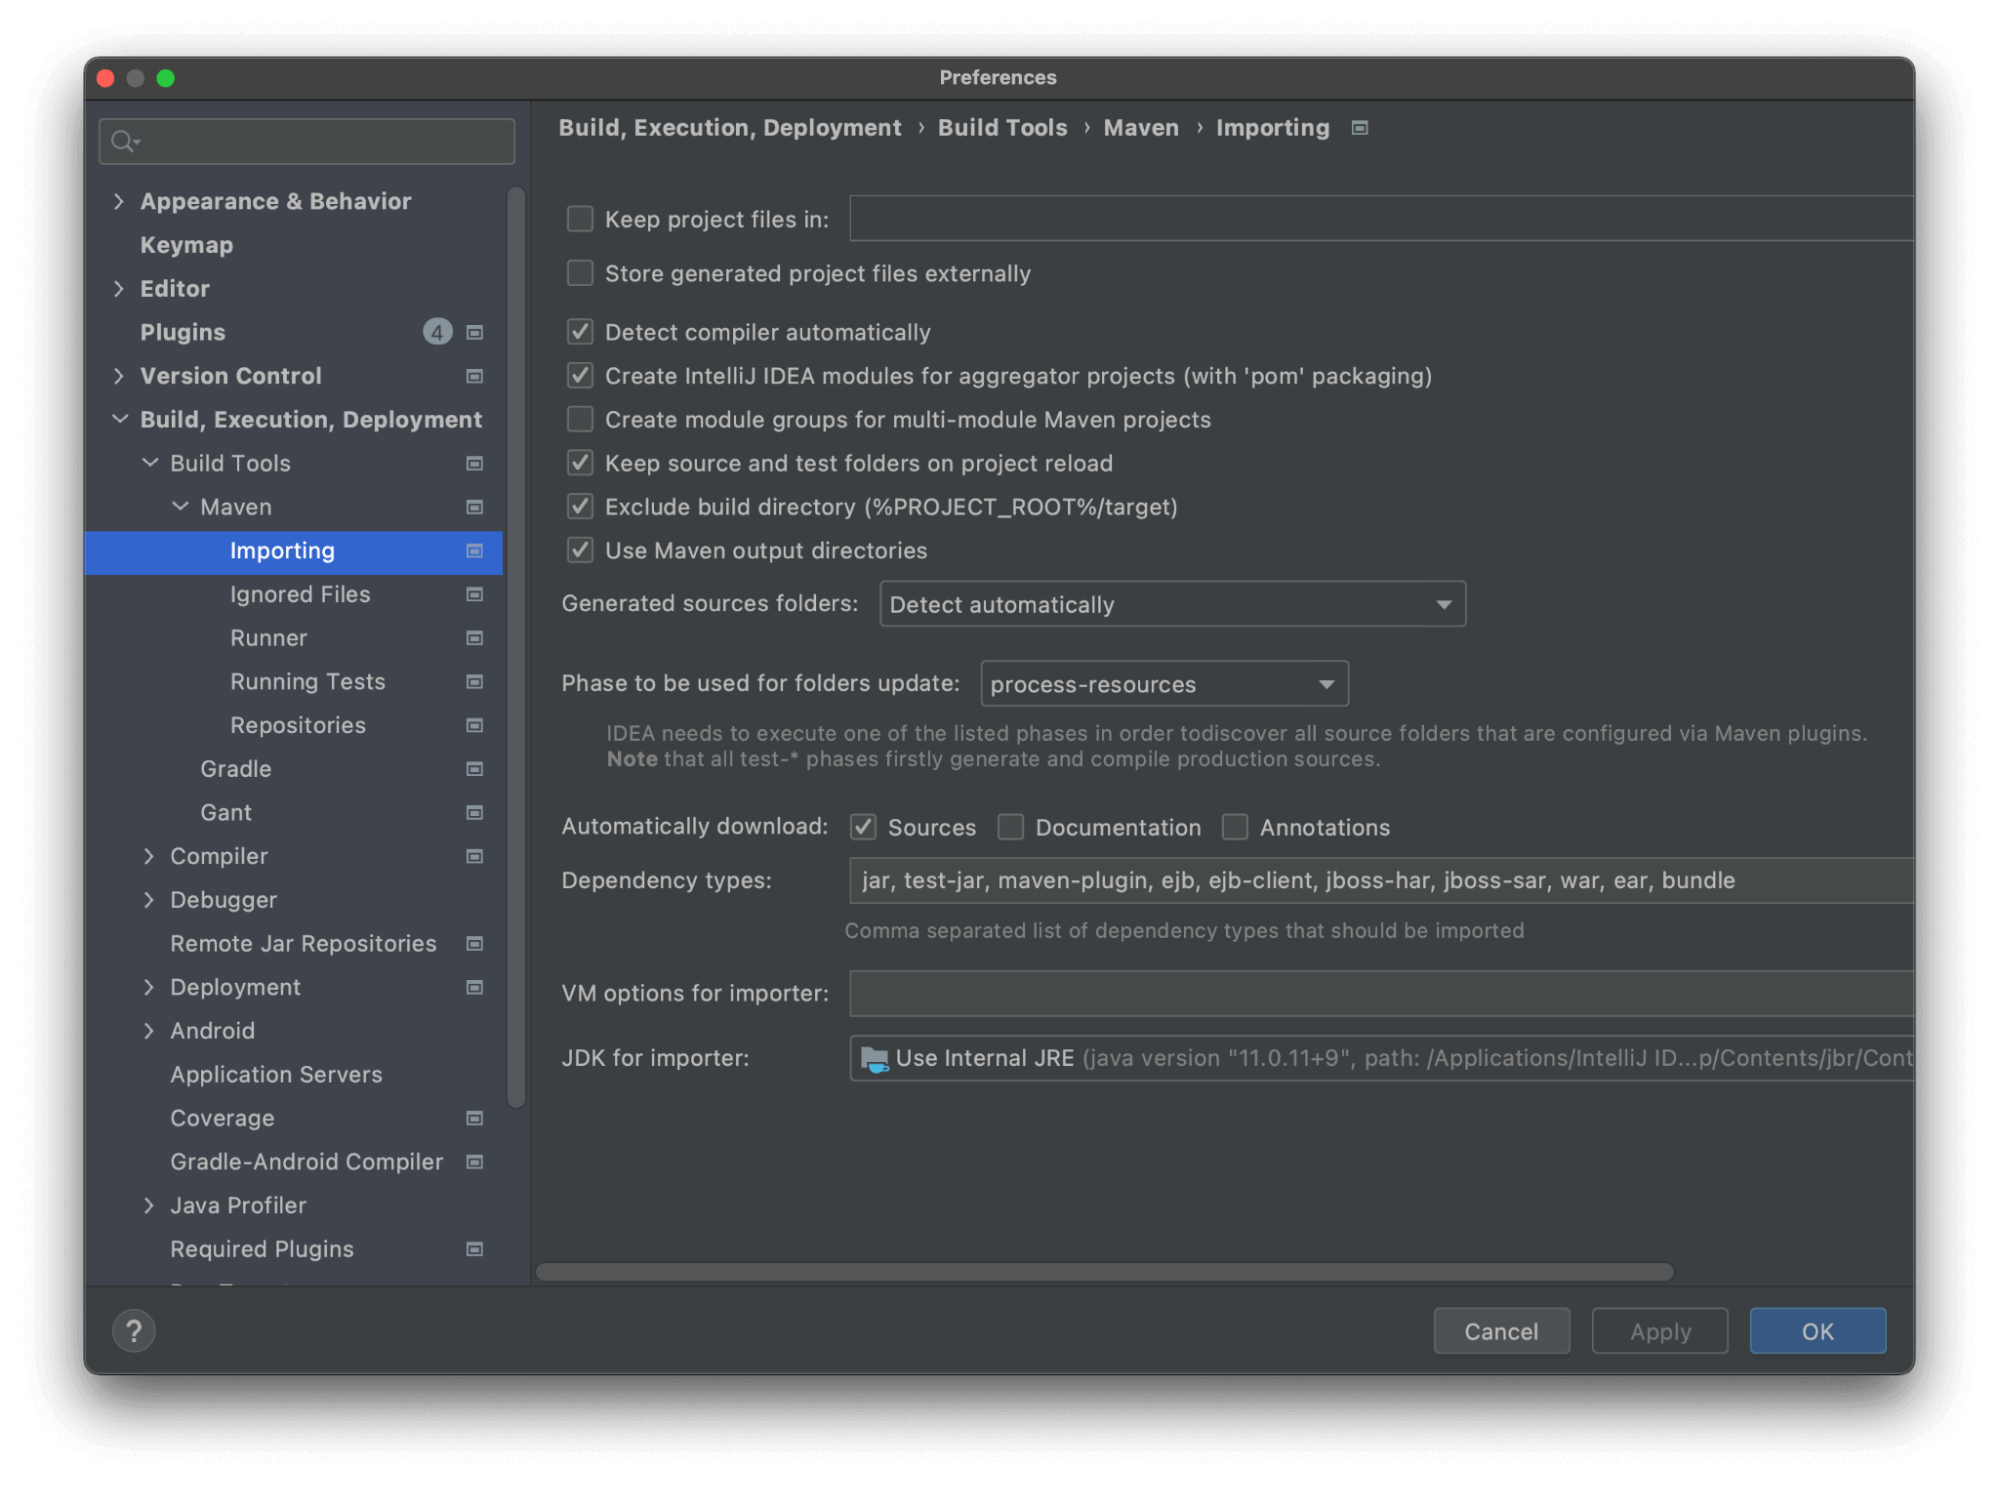
Press OK.
Next we need to open the HTTP code. Select Navigate -> Class from the menu (Command+O or Control+O). Then type in FrameworkServlet:
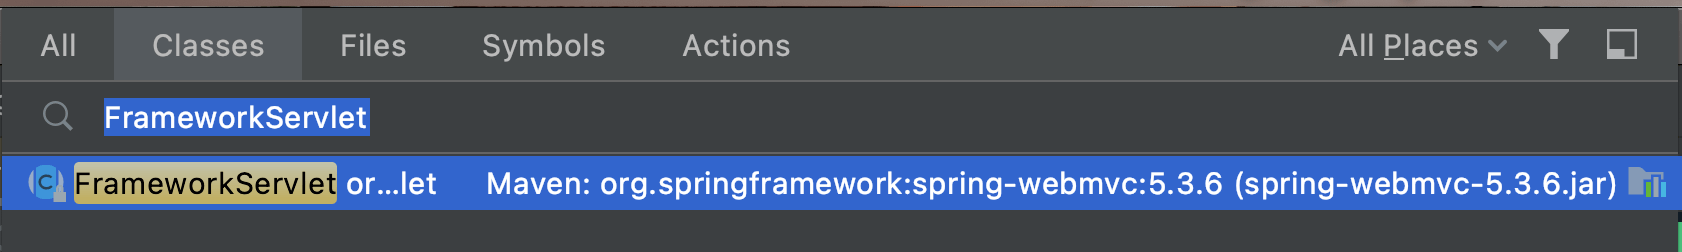
Important: If the file that opens is a decompiled .class file, click the Download Sources banner at the top of the editor. The file must be a Java source file.
Go to the authenticate method and right click on the first line and add a snapshot like before.
Try the curl operation again. You should see a proper stack trace if Spring was reached. You can now debug Spring itself with logs and snapshots to see what failed and why your code wasn’t reached:

Apply This to Your Own Application
You might need to track this deeper in the Spring code as there are many classes and layers. Most of the instructions here should be applicable to almost any application you’re working on.
Binding the agent and the rest of the instructions should apply almost exactly the same to most cases.
See Also
See more posts in this series:
It’s Really not that Complicated.
You can actually understand what’s going on inside your live applications.