

1. Introduction
Who are our “potential” customers? What should be the features of our upcoming product? These are the questions that every company wants to know these days.
To find such answers, companies rush to fetch and pile up the data. Also, Nielson’s tagline: “What people watch, listen to, or buy,” collects every type of data. Although this may be true, however, more data does not mean more knowledge.
As can be seen, structured and unstructured, both types of data filing up the digital universe. In this situation, the extraction of knowledge from extensive data can play a vital role in decision-making. We can use data mining tools to predict trends and enable knowledge-driven decisions with this intention in mind.
In this tutorial, we’ll learn about the WEKA data mining tool.
2. Data Mining
Simply put, data mining is a process of finding patterns and correlations within large datasets to forecast results. These results uncover trends, common themes, or patterns in the data.
For example, a superstore’s owner wanted to know the items that are frequently purchased together. After analyzing customer’s transactions for several weeks, he found:
- sale of bread surprisingly increased up to 75% when a customer purchases milk
- 60% people liked to buy eggs together with milk and bread
All things considered, the owner will ensure that the store has enough products at the right time and place to increase the revenue.
Data mining helps companies to discover much-needed knowledge.
2.1. Data Mining Process
The data mining process consists of several steps. First, data acquisition, cleaning, and integration happen. Then, because different datasets come from various sources, it is necessary to remove inconsistencies and make all of them align.
Next, selection of appropriate features takes place. Generally, data have many irrelevant attributes and dimensions. So selection of the right attributes and dimension reduction is essential to produce quality results.
Then the choice of the suitable algorithm for the underline problem. There are specific algorithms for each type of problem. So it is imperative to know whether it is a classification or a clustering problem exactly.
Finally, patterns and rules generated by the data mining algorithm are interpreted for helpful knowledge.
3. WEKA
WEKA is a workbench that contains machine learning algorithms for data mining tasks. On the whole, these tasks vary from data preparation to data visualization and from classification to clustering. Although WEKA’s strength lies in classification, however, it can also perform regression, clustering, and mining of association rules efficiently.
It is an open-source toolkit available under the GNU General Public License.
3.1. Requirements & Installation
We can install WEKA on Windows, MAC OS, and Linux. The minimum requirement is Java 8 or above for the latest stable release.
Let’s look at WEKA’s main graphical user interface:
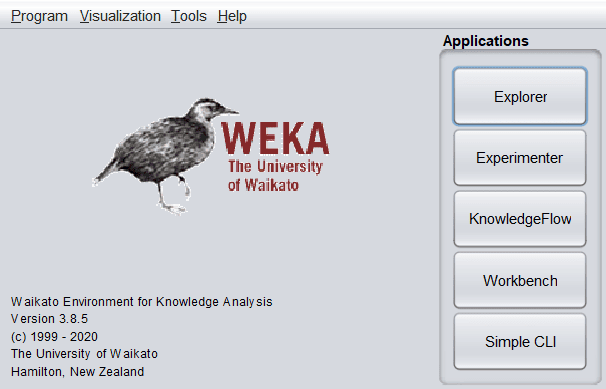
As shown above, there are five options available in the Applications category. The Explorer is the central panel where most data mining tasks are performed. We will further explore this panel in upcoming sections.
Besides the Explorer, the tool provides an Experimenter panel. Under this, we can not only run experiments but also design them.
On the one hand, we have Explorer and Experimenter, and on the other hand, WEKA provides the KnowledgeFlow panel. It provides an interface to drag and drop components, connect them to form a knowledge flow and analyze the data and results.
The Simple CLI panel provides the command line powers to run WEKA. For example, to fire up the ZeroR classifier on the iris.arff data, we’ll run from the command line:
java weka.classifiers.trees.ZeroR -t iris.arff3.2. Dataset
Dataset is an essential aspect of any data mining task. In this tutorial, we’ll use the Iris dataset for the training and testing of several algorithms. The multivariate dataset contains three species and four features.
3.3. Types & Format of Data
Numeric (Integer and Real), String, Date, and Relational are the only four datatypes provided by WEKA. By default, WEKA supports the ARFF format. The ARFF, attribute-relation file format, is an ASCII format that describes a list of instances sharing a set of attributes.
Every ARFF file has two sections: header and data. The header section consists of attribute types, and the data section contains a comma-separated list of data for that attributes. It is important to note that the declaration of the header (@attribute) and the data (@data) are case-insensitive.
Let’s look at the format with a weather forecast dataset:
@attribute outlook {sunny,overcast,rainy}
@attribute tempreture {hot,mild,cool}
@attribute humidity {high,normal}
@attribute windy {TRUE,FALSE}
@attribute play {yes,no}

@data
sunny,hot,high,FALSE,no
sunny,hot,high,TRUE,yes
overcast,hot,high,TRUE,yes
overcast,cool,normal,TRUE,yes
rainy,cool,normal,FALSE,no
rainy,cool,normal,TRUE,no
Other than ARFF, the tool also supports different file formats such as CSV, JSON, and XRFF.
3.4. Loading of Data
WEKA allows you to load data from four types of sources:
- the local file system
- a public URL
- query to a database
- generate artificial data to run models
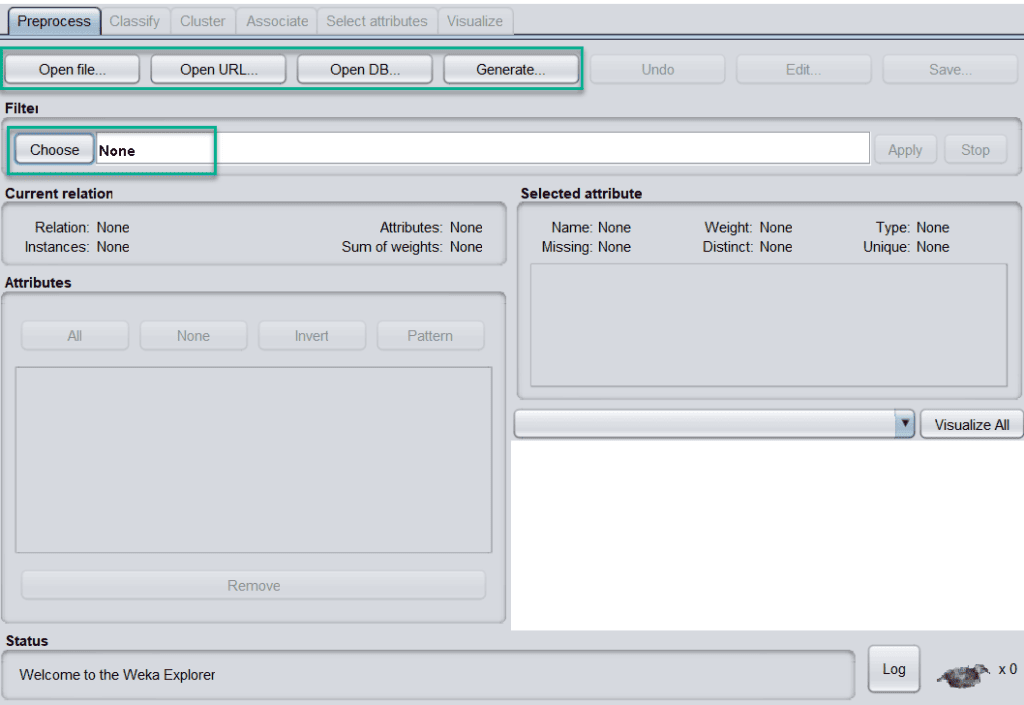
Once data is loaded from different sources, the next step is to preprocess the data. For this purpose, we can choose any suitable filter technique. All the methods come up with default settings that are configurable by clicking on the name:
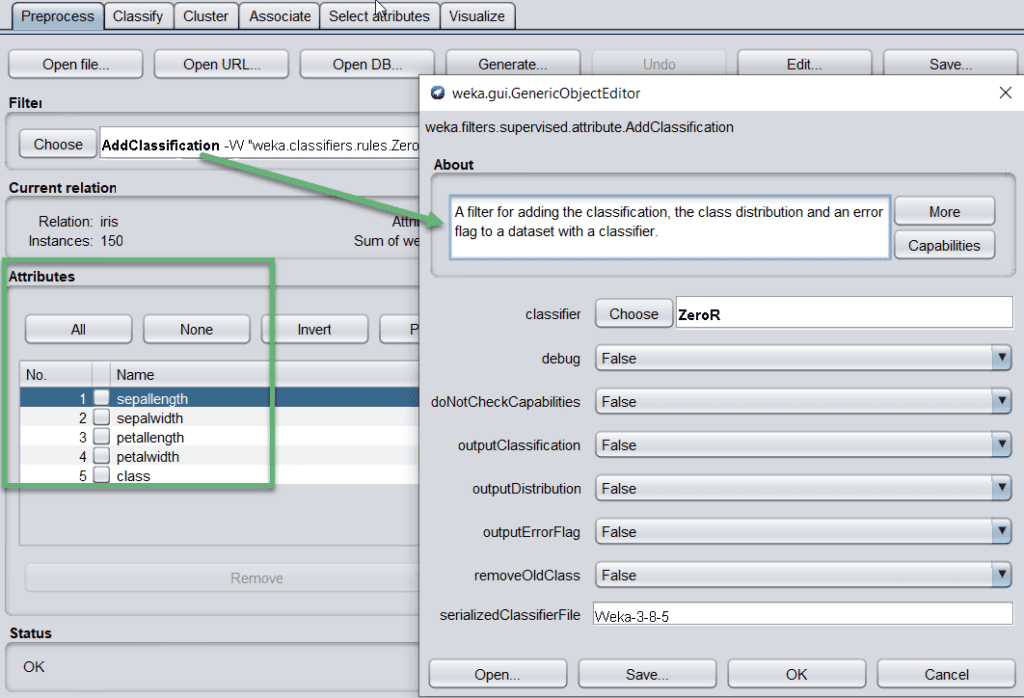
If there are some errors/outliers in one of the attributes, such as sepallength, in that case, we can remove/update it from the Attributes section.
3.5. Types of Machine Learning Algorithms
WEKA provides ample amounts of algorithms for machine learning tasks. All the algorithms, because of their core nature, are divided into several groups. These are available under the “Explorer” tab of the WEKA.
Let’s look at those groups and their core nature:
- bayes – consists of algorithms based on Bayes theorem like Naive Bayes
- functions – comprises the algorithms that estimate a function, including Linear Regression
- lazy – covers all algorithms that use lazy learning similar to KStar, LWL
- meta – consists of those algorithms that use or integrate multiple algorithms for their work like Stacking, Bagging
- misc – miscellaneous algorithms that do not fit any of given category
- rules – combines algorithms that use rules such as OneR, ZeroR
- trees – contains algorithms that use decision trees, such as J48, RandomForest
Each algorithm comes up with configuration params such as batchSize, debug, etc. Some of the configuration params are common across all the algorithms, while some are specific. These configurations can be editable once the algorithm is selected to use.
4. WEKA’s Features
4.1. Preprocess
The preprocessing of data is a crucial task in data mining. Because most of the data is raw, there are chances that it may contain empty or duplicate values, have garbage values, outliers, extra columns, or have a different naming convention. All these things degrade the results.
To make data cleaner, better and comprehensive, WEKA comes up with a comprehensive set of options under the filter category. Here, the tool provides both supervised and unsupervised types of operations.
Here is the list of some operations for preprocessing:
- ReplaceMissingWithUserConstant – to fix empty or null value issue
- ReservoirSample – to generate a random subset of sample data
- NominalToBinary – to convert the data from nominal to binary
- RemovePercentage – to remove a given percentage of data
- RemoveRange – to remove a given range of data
4.2. Classify
Classification is one of the essential functions in machine learning, where we assign classes or categories to items. The classic examples of classification are: declaring a brain tumor as “malignant” or “benign” or assigning an email to “spam” or “not_spam” class.
After the selection of the desired classifier, we select test options for the training set. Some of the options are:
- Use training set – the classifier will be tested on the same training set
- Supplied test set – evaluates the classifier based on a separate test set
- Cross-validation Folds – assessment of the classifier based on cross-validation using the number of provided folds
- Percentage split – the classifier will be judged on a specific percentage of data
Other than these, we can also use more test options such as Preserve order for % split, Output source code, etc.
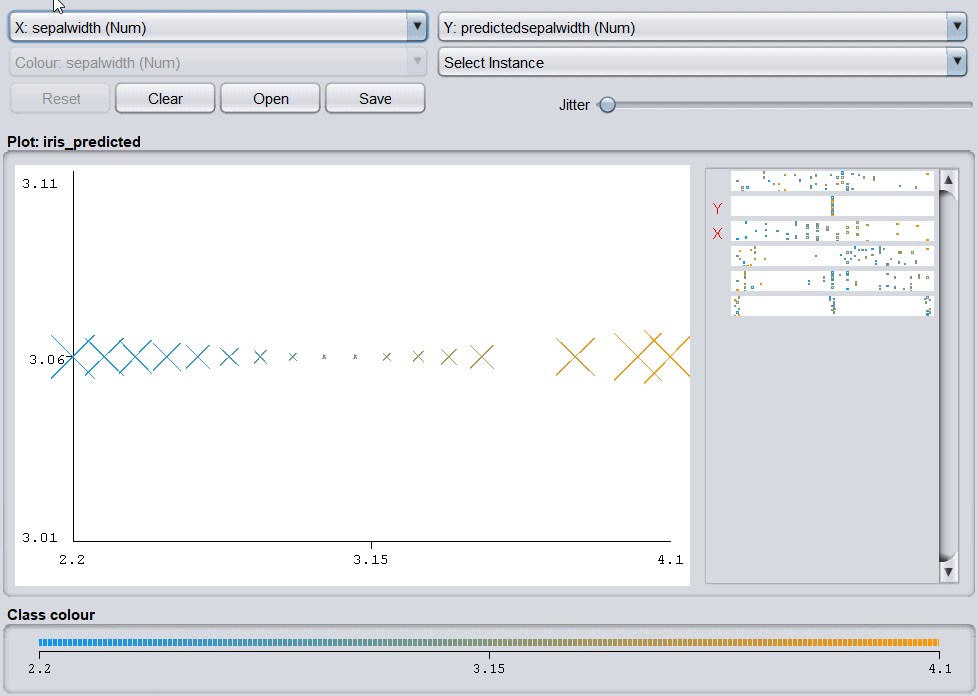
Let’s apply ZeroR classifier to the dataset. To begin with, this classifier is the implementation of the 0-R classifier and allows batch processing. After successful execution, the tool generates the summary and presents the algorithm’s effectiveness based on different parameters:
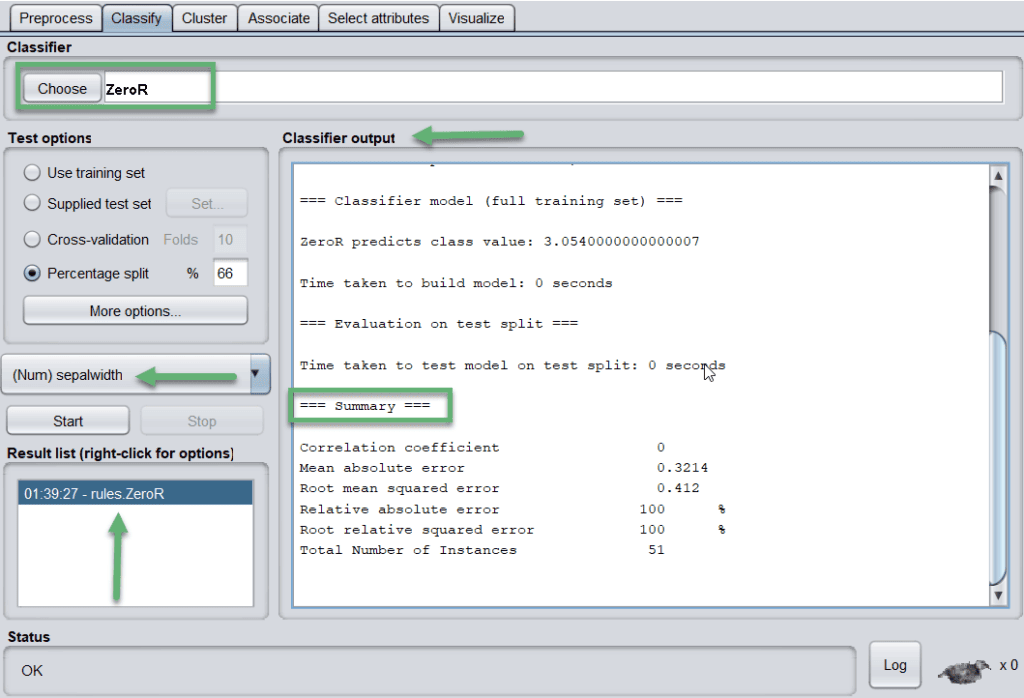
The tool saves the results in the Result list (highlighted blue). Let’s look at how results are plotted on the graph:
4.3. Cluster
In clustering, a dataset is arranged in different groups/clusters based on some similarities. In this case, the items within the same cluster are identical but different from other clusters. The examples of clustering include, but are not limited to, identifying customers with similar behaviors, organizing the regions according to homogenous land use.
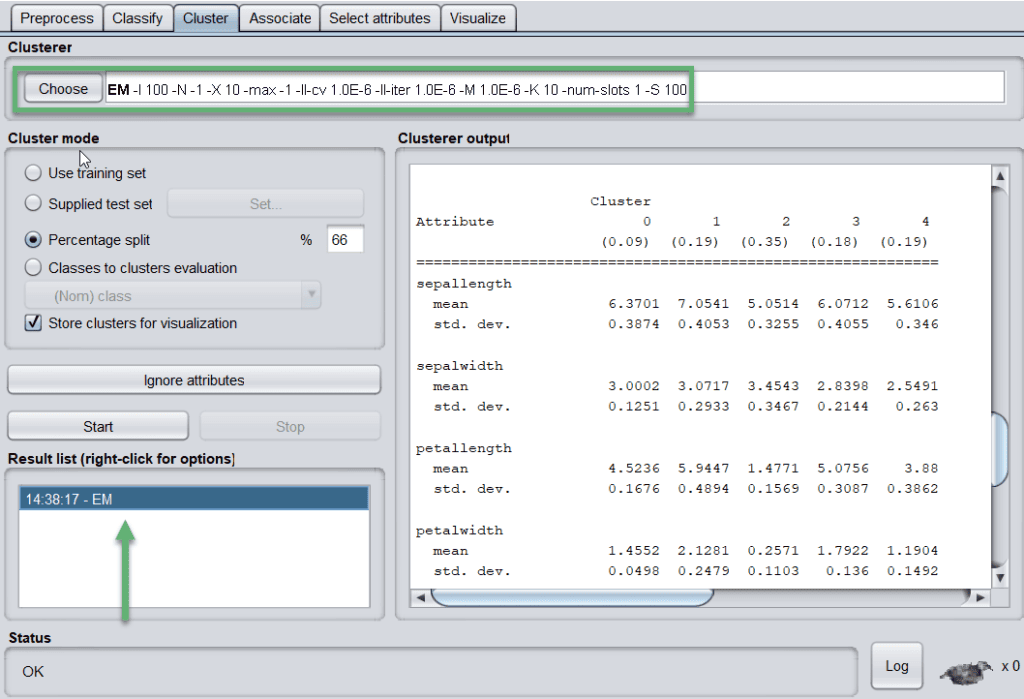
When we apply the EM algorithm, the tool shows the mean and standard deviation of the clusters and attributes:
Let’s look at how results are plotted:
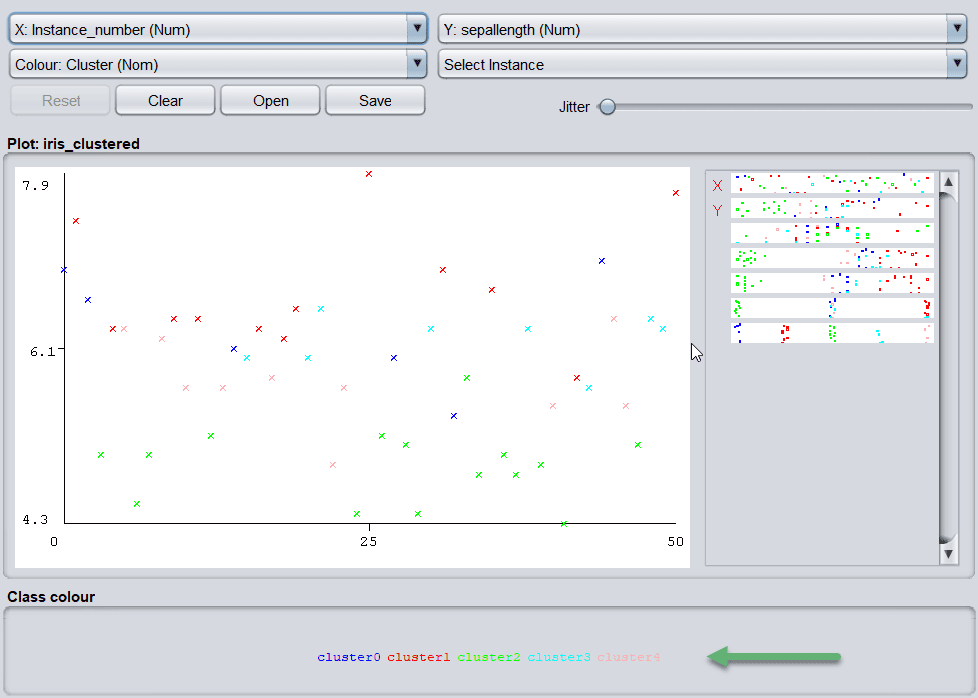
The most popular clustering algorithms that WEKA offers are SimpleKMeans, HierarchicalClusterer, and EM.
4.4. Associate
Association rules highlight all the associations and correlations between items of a dataset. In short, it is an if-then statement that depicts the probability of relationships between data items. A classic example of association refers to a connection between the sale of milk and bread.
In this category, the tool provides Apriori, FilteredAssociator, FPGrowth algorithms for association rules mining.
4.5. Select Attributes
Every dataset contains a lot of attributes, but several of them may not be significantly valuable. Therefore, removing the unnecessary and keeping the relevant details are very important for building a good model.
There are many attribute evaluators and search methods, including BestFirst, GreedyStepwise, and Ranker.
4.6. Visualize
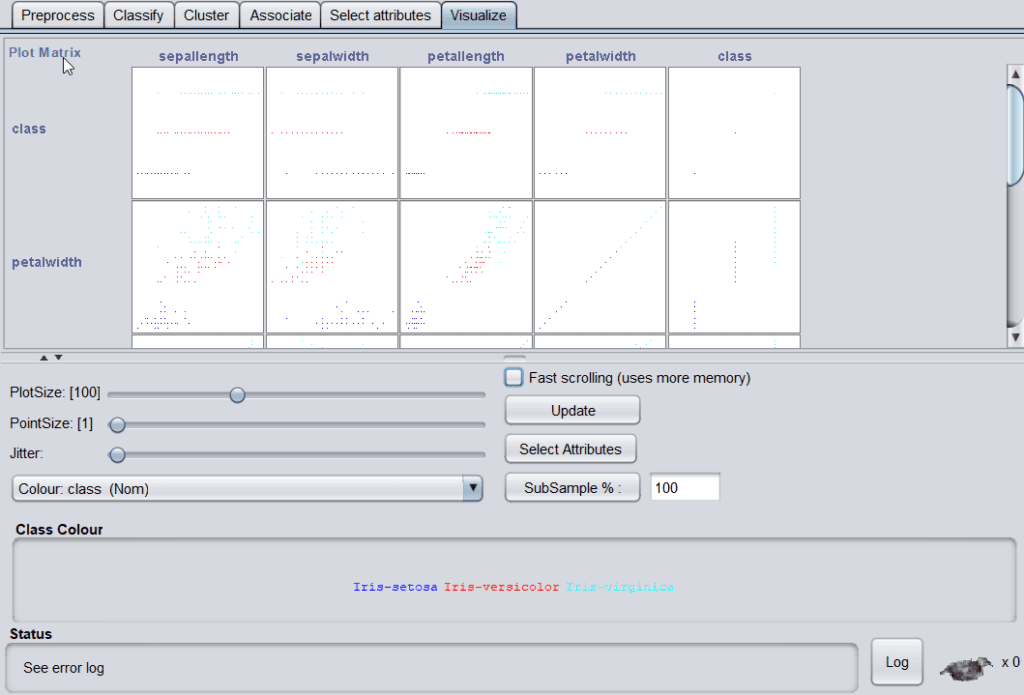
In the visualize tab, different plot matrix and graphs are available to show the trends and errors identified by the model.
Some of the values for the iris dataset are:
5. Conclusion
From retail market to healthcare and sports to surveillance, data analytics are everywhere. Without a doubt, it requires a lot of effort to extract the knowledge from raw data. This extracted knowledge helps us develop intelligent decisions, run accurate campaigns, increase revenues, improve customer relationships, reduce risks, and detect online fraud.
In this article, we learned about WEKA, which is a comprehensive toolkit for data mining tasks. The tool comes up with many options, from data cleaning to selecting features and applying different algorithms in each category. In the final analysis, WEKA makes it much easier to work with a large dataset and compare various outputs to arrive at a result.