

Mocking is an essential part of unit testing, and the Mockito library makes it easy to write clean and intuitive unit tests for your Java code.
Get started with mocking and improve your application tests using our Mockito guide:
Handling concurrency in an application can be a tricky process with many potential pitfalls. A solid grasp of the fundamentals will go a long way to help minimize these issues.
Get started with understanding multi-threaded applications with our Java Concurrency guide:
Spring 5 added support for reactive programming with the Spring WebFlux module, which has been improved upon ever since. Get started with the Reactor project basics and reactive programming in Spring Boot:
Since its introduction in Java 8, the Stream API has become a staple of Java development. The basic operations like iterating, filtering, mapping sequences of elements are deceptively simple to use.
But these can also be overused and fall into some common pitfalls.
To get a better understanding on how Streams work and how to combine them with other language features, check out our guide to Java Streams:
Explore Spring Boot 3 and Spring 6 in-depth through building a full REST API with the framework:
Yes, Spring Security can be complex, from the more advanced functionality within the Core to the deep OAuth support in the framework.
I built the security material as two full courses - Core and OAuth, to get practical with these more complex scenarios. We explore when and how to use each feature and code through it on the backing project.
You can explore the course here:
Spring Data JPA is a great way to handle the complexity of JPA with the powerful simplicity of Spring Boot.
Get started with Spring Data JPA through the guided reference course:
Refactor Java code safely — and automatically — with OpenRewrite.
Refactoring big codebases by hand is slow, risky, and easy to put off. That’s where OpenRewrite comes in. The open-source framework for large-scale, automated code transformations helps teams modernize safely and consistently.
Each month, the creators and maintainers of OpenRewrite at Moderne run live, hands-on training sessions — one for newcomers and one for experienced users. You’ll see how recipes work, how to apply them across projects, and how to modernize code with confidence.
Join the next session, bring your questions, and learn how to automate the kind of work that usually eats your sprint time.
Distributed systems often come with complex challenges such as service-to-service communication, state management, asynchronous messaging, security, and more.
Dapr (Distributed Application Runtime) provides a set of APIs and building blocks to address these challenges, abstracting away infrastructure so we can focus on business logic.
In this tutorial, we'll focus on Dapr's pub/sub API for message brokering. Using its Spring Boot integration, we'll simplify the creation of a loosely coupled, portable, and easily testable pub/sub messaging system:
1. Overview
Netflix Servo is a metrics tool for Java applications. Servo is similar to Dropwizard Metrics, yet much simpler. It leverages JMX only to provide a simple interface for exposing and publishing application metrics.
In this article, we’ll introduce what Servo provides and how can we use it to collect and publish application metrics.
2. Maven Dependencies
Before we dive into actual implementation, let’s add the Servo dependency to the pom.xml file:
<dependency>
    <groupId>com.netflix.servo</groupId>
    <artifactId>servo-core</artifactId>
    <version>0.13.2</version>
</dependency>
Besides, there are many extensions available, such as Servo-Apache, Servo-AWS, etc. We may need them later. Latest versions of these extensions can also be found on Maven Central.
3. Collect Metrics
First, let’s see how to gather metrics from our application.
Servo provides four primary metric types: Counter, Gauge, Timer, and Informational.
3.1. Metric Types – Counter
Counters are used to record incrementation. Commonly used implementations are BasicCounter, StepCounter, and PeakRateCounter.
BasicCounter does what a counter should do, plain and straightforward:
Counter counter = new BasicCounter(MonitorConfig.builder("test").build());
assertEquals("counter should start with 0", 0, counter.getValue().intValue());

counter.increment();

assertEquals("counter should have increased by 1", 1, counter.getValue().intValue());

counter.increment(-1);

assertEquals("counter should have decreased by 1", 0, counter.getValue().intValue());
PeakRateCounter returns the maximum count for a given second during the polling interval:
Counter counter = new PeakRateCounter(MonitorConfig.builder("test").build());
assertEquals(
  "counter should start with 0",
  0, counter.getValue().intValue());

counter.increment();
SECONDS.sleep(1);

counter.increment();
counter.increment();

assertEquals("peak rate should have be 2", 2, counter.getValue().intValue());
Unlike other counters, StepCounter records rate per second of previous polling interval:
System.setProperty("servo.pollers", "1000");
Counter counter = new StepCounter(MonitorConfig.builder("test").build());

assertEquals("counter should start with rate 0.0", 0.0, counter.getValue());

counter.increment();
SECONDS.sleep(1);

assertEquals(
  "counter rate should have increased to 1.0",
  1.0, counter.getValue());
Notice that we set the servo.pollers to 1000 in the code above. That was to set the polling interval to 1 second instead of intervals of 60 seconds and 10 seconds by default. We’ll cover more on this later.
3.2. Metric Types – Gauge
Gauge is a simple monitor that returns the current value. BasicGauge, MinGauge, MaxGauge, and NumberGauges are provided.
BasicGauge invokes a Callable to get the current value. We can get the size of a collection, latest value of a BlockingQueue or any value that requires small computations.
Gauge<Double> gauge = new BasicGauge<>(MonitorConfig.builder("test")
  .build(), () -> 2.32);

assertEquals(2.32, gauge.getValue(), 0.01);
MaxGauge and MinGauge are used to keep track of the maximum and minimum values respectively:
MaxGauge gauge = new MaxGauge(MonitorConfig.builder("test").build());
assertEquals(0, gauge.getValue().intValue());

gauge.update(4);
assertEquals(4, gauge.getCurrentValue(0));

gauge.update(1);
assertEquals(4, gauge.getCurrentValue(0));
NumberGauge (LongGauge, DoubleGauge) wraps a provided Number (Long, Double). To collect metrics using these gauges, we must ensure the Number is thread-safe.
3.3. Metric Types – Timer
Timers help measure duration of a particular event. Default implementations are BasicTimer, StatsTimer, and BucketTimer.
BasicTimer records total time, count and other simple statistics:
BasicTimer timer = new BasicTimer(MonitorConfig.builder("test").build(), SECONDS);
Stopwatch stopwatch = timer.start();

SECONDS.sleep(1);
timer.record(2, SECONDS);
stopwatch.stop();

assertEquals("timer should count 1 second", 1, timer.getValue().intValue());
assertEquals("timer should count 3 seconds in total",
  3.0, timer.getTotalTime(), 0.01);
assertEquals("timer should record 2 updates", 2, timer.getCount().intValue());
assertEquals("timer should have max 2", 2, timer.getMax(), 0.01);
StatsTimer provides much richer statistics by sampling between polling intervals:
System.setProperty("netflix.servo", "1000");
StatsTimer timer = new StatsTimer(MonitorConfig
  .builder("test")
  .build(), new StatsConfig.Builder()
  .withComputeFrequencyMillis(2000)
  .withPercentiles(new double[] { 99.0, 95.0, 90.0 })
  .withPublishMax(true)
  .withPublishMin(true)
  .withPublishCount(true)
  .withPublishMean(true)
  .withPublishStdDev(true)
  .withPublishVariance(true)
  .build(), SECONDS);
Stopwatch stopwatch = timer.start();

SECONDS.sleep(1);
timer.record(3, SECONDS);
stopwatch.stop();

stopwatch = timer.start();
timer.record(6, SECONDS);
SECONDS.sleep(2);
stopwatch.stop();

assertEquals("timer should count 12 seconds in total",
  12, timer.getTotalTime());
assertEquals("timer should count 12 seconds in total",
  12, timer.getTotalMeasurement());
assertEquals("timer should record 4 updates", 4, timer.getCount());
assertEquals("stats timer value time-cost/update should be 2",
  3, timer.getValue().intValue());

final Map<String, Number> metricMap = timer.getMonitors().stream()
  .collect(toMap(monitor -> getMonitorTagValue(monitor, "statistic"),
    monitor -> (Number) monitor.getValue()));

assertThat(metricMap.keySet(), containsInAnyOrder(
  "count", "totalTime", "max", "min", "variance", "stdDev", "avg",
  "percentile_99", "percentile_95", "percentile_90"));
BucketTimer provides a way to get the distribution of samples by bucketing value ranges:
BucketTimer timer = new BucketTimer(MonitorConfig
  .builder("test")
  .build(), new BucketConfig.Builder()
  .withBuckets(new long[] { 2L, 5L })
  .withTimeUnit(SECONDS)
  .build(), SECONDS);

timer.record(3);
timer.record(6);

assertEquals(
  "timer should count 9 seconds in total",
  9, timer.getTotalTime().intValue());

Map<String, Long> metricMap = timer.getMonitors().stream()
  .filter(monitor -> monitor.getConfig().getTags().containsKey("servo.bucket"))
  .collect(toMap(
    m -> getMonitorTagValue(m, "servo.bucket"),
    m -> (Long) m.getValue()));

assertThat(metricMap, allOf(hasEntry("bucket=2s", 0L), hasEntry("bucket=5s", 1L),
  hasEntry("bucket=overflow", 1L)));
To track long-time operations that might last for hours, we can use the composite monitor DurationTimer.
3.4. Metric Types – Informational
Also, we can make use of the Informational monitor to record descriptive information to help debugging and diagnostics. The only implementation is BasicInformational, and its usage cannot be simpler:
BasicInformational informational = new BasicInformational(
  MonitorConfig.builder("test").build());
informational.setValue("information collected");
3.5. MonitorRegistry
The metric types are all of type Monitor, which is the very base of Servo. We now know kinds of tools collect raw metrics, but to report the data, we need to register these monitors.
Note that each single configured monitor should be registered once and only once to ensure the correctness of metrics. So we can register the monitors using Singleton pattern.
Most of the time, we can use DefaultMonitorRegistry to register monitors:
Gauge<Double> gauge = new BasicGauge<>(MonitorConfig.builder("test")
  .build(), () -> 2.32);
DefaultMonitorRegistry.getInstance().register(gauge);
If we want to dynamically register a monitor, DynamicTimer, and DynamicCounter can be used:
DynamicCounter.increment("monitor-name", "tag-key", "tag-value");Note that dynamic registration would cause expensive lookup operation each time the value is updated.
Servo also provides several helper methods to register monitors declared in objects:
Monitors.registerObject("testObject", this);
assertTrue(Monitors.isObjectRegistered("testObject", this));
Method registerObject will use reflection to add all instances of Monitors declared by annotation @Monitor and add tags declared by @MonitorTags:
@Monitor(
  name = "integerCounter",
  type = DataSourceType.COUNTER,
  description = "Total number of update operations.")
private AtomicInteger updateCount = new AtomicInteger(0);

@MonitorTags
private TagList tags = new BasicTagList(
  newArrayList(new BasicTag("tag-key", "tag-value")));

@Test
public void givenAnnotatedMonitor_whenUpdated_thenDataCollected() throws Exception {
    System.setProperty("servo.pollers", "1000");
    Monitors.registerObject("testObject", this);
    assertTrue(Monitors.isObjectRegistered("testObject", this));

    updateCount.incrementAndGet();
    updateCount.incrementAndGet();
    SECONDS.sleep(1);

    List<List<Metric>> metrics = observer.getObservations();

    assertThat(metrics, hasSize(greaterThanOrEqualTo(1)));

    Iterator<List<Metric>> metricIterator = metrics.iterator();
    metricIterator.next(); //skip first empty observation

    while (metricIterator.hasNext()) {
        assertThat(metricIterator.next(), hasItem(
          hasProperty("config",
          hasProperty("name", is("integerCounter")))));
    }
}
4. Publish Metrics
With the metrics collected, we can publish it to in any format, such as rendering time series graphs on various data visualization platforms. To publish the metrics, we need to poll the data periodically from the monitor observations.
4.1. MetricPoller
MetricPoller is used as a metrics fetcher. We can fetch metrics of MonitorRegistries, JVM, JMX. With the help of extensions, we can poll metrics like Apache server status and Tomcat metrics.
MemoryMetricObserver observer = new MemoryMetricObserver();
PollRunnable pollRunnable = new PollRunnable(new JvmMetricPoller(),
  new BasicMetricFilter(true), observer);
PollScheduler.getInstance().start();
PollScheduler.getInstance().addPoller(pollRunnable, 1, SECONDS);

SECONDS.sleep(1);
PollScheduler.getInstance().stop();
List<List<Metric>> metrics = observer.getObservations();

assertThat(metrics, hasSize(greaterThanOrEqualTo(1)));
List<String> keys = extractKeys(metrics);

assertThat(keys, hasItems("loadedClassCount", "initUsage", "maxUsage", "threadCount"));
Here we created a JvmMetricPoller to poll metrics of JVM. When adding the poller to the scheduler, we let the poll task to run every second. System default poller configurations are defined in Pollers, but we can specify pollers to use with system property servo.pollers.
4.2. MetricObserver
When polling metrics, observations of registered MetricObservers will be updated.
MetricObservers provided by default are MemoryMetricObserver, FileMetricObserver, and AsyncMetricObserver. We have already shown how to use MemoryMetricObserver in the previous code sample.
Currently, several useful extensions are available:
- AtlasMetricObserver: publish metrics to Netflix Atlas to generate in memory time series data for analytics
- CloudWatchMetricObserver: push metrics to Amazon CloudWatch for metrics monitoring and tracking
- GraphiteObserver: publish metrics to Graphite to store and graph
We can implement a customized MetricObserver to publish application metrics to where we see fit. The only thing to care about is to handle the updated metrics:
public class CustomObserver extends BaseMetricObserver {

    //...

    @Override
    public void updateImpl(List<Metric> metrics) {
        //TODO
    }
}
4.3. Publish to Netflix Atlas
Atlas is another metrics-related tool from Netflix. It’s a tool for managing dimensional time series data, which is a perfect place to publish the metrics we collected.
Now, we’ll demonstrate how to publish our metrics to Netflix Atlas.
First, let’s append the servo-atlas dependency to the pom.xml:
<dependency>
      <groupId>com.netflix.servo</groupId>
      <artifactId>servo-atlas</artifactId>
      <version>${netflix.servo.ver}</version>
</dependency>

<properties>
    <netflix.servo.ver>0.13.2</netflix.servo.ver>
</properties>
This dependency includes an AtlasMetricObserver to help us publish metrics to Atlas.
Then, we shall set up an Atlas server:
$ curl -LO 'https://github.com/Netflix/atlas/releases/download/v1.4.4/atlas-1.4.4-standalone.jar'
$ curl -LO 'https://raw.githubusercontent.com/Netflix/atlas/v1.4.x/conf/memory.conf'
$ java -jar atlas-1.4.4-standalone.jar memory.conf
To save our time for the test, let’s set the step size to 1 second in memory.conf, so that we can generate a time series graph with enough details of the metrics.
The AtlasMetricObserver requires a simple configuration and a list of tags. Metrics of the given tags will be pushed to Atlas:
System.setProperty("servo.pollers", "1000");
System.setProperty("servo.atlas.batchSize", "1");
System.setProperty("servo.atlas.uri", "http://localhost:7101/api/v1/publish");
AtlasMetricObserver observer = new AtlasMetricObserver(
  new BasicAtlasConfig(), BasicTagList.of("servo", "counter"));

PollRunnable task = new PollRunnable(
  new MonitorRegistryMetricPoller(), new BasicMetricFilter(true), observer);
After starting up a PollScheduler with the PollRunnable task, we can publish metrics to Atlas automatically:
Counter counter = new BasicCounter(MonitorConfig
.builder("test")
.withTag("servo", "counter")
.build());
DefaultMonitorRegistry
.getInstance()
.register(counter);
assertThat(atlasValuesOfTag("servo"), not(containsString("counter")));
for (int i = 0; i < 3; i++) {
counter.increment(RandomUtils.nextInt(10));
SECONDS.sleep(1);
counter.increment(-1 * RandomUtils.nextInt(10));
SECONDS.sleep(1);
}
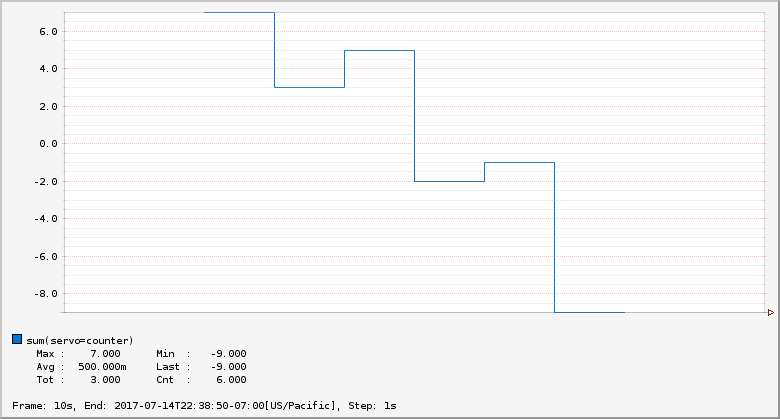
assertThat(atlasValuesOfTag("servo"), containsString("counter"));Based on the metrics, we can generate a line graph using graph API of Atlas:
5. Summary
In this article, we have introduced how to use Netflix Servo to collect and publish application metrics.
In case you haven’t read our introduction to Dropwizard Metrics, check it out here for a quick comparison with Servo.


