
An in-depth piece exploring building a modular event-driven microservices architecture, using Spring and Orkes Conductor for orchestration:
1. Overview
In this tutorial, we’re going to look at how we can present data on a histogram with the help of Apache Commons Frequency class.
The Frequency class is part of part of the Apache Commons Math library explored in this article.
A histogram is a diagram of connected bars that shows the occurrence of a range of data in a dataset. It differs from a bar chart in that it’s used to display the distribution of continuous, quantitative variables while a bar chart is used to display categorical data.
2. Project Dependencies
In this article, we’ll be using a Maven project with the following dependencies:
<dependency>
    <groupId>org.apache.commons</groupId>
    <artifactId>commons-math3</artifactId>
    <version>3.6.1</version>
</dependency>
<dependency>
    <groupId>org.knowm.xchart</groupId>
    <artifactId>xchart</artifactId>
    <version>3.8.2</version>
</dependency>
The commons-math3 library contains the Frequency class that we’ll be using to determine the occurrence of variables in our dataset. The xchart library is what we’ll use to display the histogram in a GUI.
The latest version of commons-math3 and xchart can be found on Maven Central.
3. Calculating the Frequency of Variables
For this tutorial, we’ll be using a dataset comprising of the students’ age in a particular school. We’ll like to see the frequency of different age groups and observe their distribution on a histogram chart.
Let’s represent the dataset with a List collection and use it to populate an instance of the Frequency class:
List<Integer> datasetList = Arrays.asList(
  36, 25, 38, 46, 55, 68,
  72, 55, 36, 38, 67, 45, 22,
  48, 91, 46, 52, 61, 58, 55);
Frequency frequency = new Frequency();
datasetList.forEach(d -> frequency.addValue(Double.parseDouble(d.toString())));
Now that we’ve populated our instance of the Frequency class, we’re going to get the count of each age in a bin and sum it up so we can get the total frequency of ages in a particular age group:
datasetList.stream()
  .map(d -> Double.parseDouble(d.toString()))
  .distinct()
  .forEach(observation -> {
      long observationFrequency = frequency.getCount(observation);
      int upperBoundary = (observation > classWidth)
        ? Math.multiplyExact( (int) Math.ceil(observation / classWidth), classWidth)
        : classWidth;
      int lowerBoundary = (upperBoundary > classWidth)
        ? Math.subtractExact(upperBoundary, classWidth)
        : 0;
      String bin = lowerBoundary + "-" + upperBoundary;

      updateDistributionMap(lowerBoundary, bin, observationFrequency);
  });
From the snippet above, we first determine the frequency of the observation using the getCount() of the Frequency class. The method returns the total number of occurrence of the observation.
Using the current observation, we dynamically determine the group it belongs to by figuring out its upper and lower boundaries relative to the class width – which is 10.
The upper and lower boundaries are concatenated to form a bin, which is stored alongside the observationFrequency in a distributionMap using the updateDistributionMap().
If the bin exists already we update the frequency, else we add it as key and set the frequency of the current observation as its value. Note that we kept track of the processed observations to avoid duplicates.
The Frequency class also have methods for determining the percentage and cumulative percentage of a variable in a dataset.
4. Plotting the Histogram Chart
Now that we’ve processed our raw dataset into a map of age groups and their respective frequencies we can use the xchart library to display the data in a histogram chart:
CategoryChart chart = new CategoryChartBuilder().width(800).height(600)
  .title("Age Distribution")
  .xAxisTitle("Age Group")
  .yAxisTitle("Frequency")
  .build();

chart.getStyler().setLegendPosition(Styler.LegendPosition.InsideNW);
chart.getStyler().setAvailableSpaceFill(0.99);
chart.getStyler().setOverlapped(true);

List yData = new ArrayList();
yData.addAll(distributionMap.values());
List xData = Arrays.asList(distributionMap.keySet().toArray());
chart.addSeries("age group", xData, yData);

new SwingWrapper<>(chart).displayChart();
We created an instance of a CategoryChart using the chart builder, then we configured it and populate it with the data for the x and y-axis.
We finally display the chart in a GUI using the SwingWrapper:
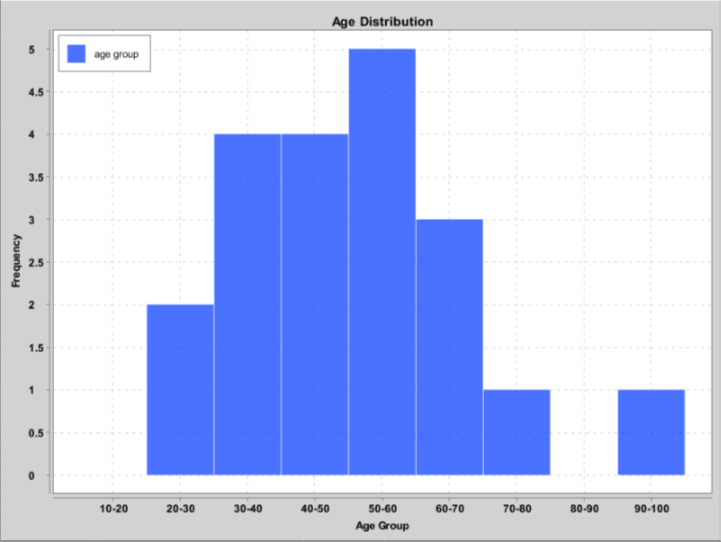
From the histogram above, we can see that there are no students with the age of 80 – 90 while students in the age 50 – 60 are predominant. This most likely will be doctoral or post-doctoral students.
We can also say the histogram has a normal distribution.
5. Conclusion
In this article, we’ve looked at how to harness the power of the Frequency class of Apache commons-math3 library.
There are other interesting classes for statistics, geometry, genetic algorithms and others in the library. Its documentation can be found here.
The complete source code is available over at Github.